
ETF Tracker StatSheet
https://theetfbully.com/2017/10/weekly-statsheet-etf-tracker-newsletter-updated-10262017/
A SLOW START FOLLOWED BY A STRONG FINISH
- Moving the Markets
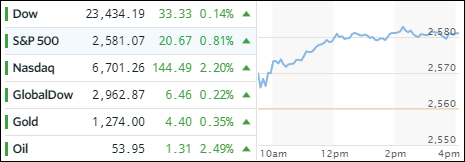
The week started out slow, and it looked like the major indexes might finish to the downside. Well, that did not happen as Amazon’s good results today put some fuel under the Nasdaq with the index rocketing higher by +2.2%. Not to be outdone, the S&P 500 raced into record territory as well, but by a smaller margin. Lagging the duo was the Dow, which barely close above the unchanged line.
This is the 5th weekly rise in the Nasdaq and the 7th in a row for the S&P and Dow. The VIX was crushed below 10 thereby lending an assist to the bullish crowd. Our ETF holdings performed nicely with Semiconductors (SMH) sporting a gain of +2.01%, followed by Emerging Markets (SCHE) with +1.21% and LargeCaps (SCHX) with +0.80%. Aerospace & Defense (ITA) was the only one showing a red number as it lost -0.12%.
While bond yields were higher for the week, today interest rates dropped allowing the 20-year bond (TLT) to score a gain of +0.66% thereby interrupting the recent losing streak. Gold and Crude oil followed the bullish equity theme and closed higher, while the US dollar (UUP) followed suit by adding +0.24% to yesterday’s gains.
- ETFs in the Spotlight (updated for 2017)
In case you missed the announcement and description of this section, you can read it here again.
It features 10 broadly diversified and sector ETFs from my HighVolume list as posted every Saturday. Furthermore, they are screened for the lowest MaxDD% number meaning they have been showing better resistance to temporary sell offs than all others over the past year.
The below table simply demonstrates the magnitude with which some of the ETFs are fluctuating in regards to their positions above or below their respective individual trend lines (%M/A). A break below, represented by a negative number, shows weakness, while a break above, represented by a positive percentage, shows strength.
For hundreds of ETF choices, be sure to reference Thursday’s StatSheet.
Year to date, here’s how the 2017 candidates have fared so far:

Again, the %M/A column above shows the position of the various ETFs in relation to their respective long term trend lines, while the trailing sell stops are being tracked in the “Off High” column. The “Action” column will signal a “Sell” once the -7.5% point has been taken out in the “Off High” column.
- Trend Tracking Indexes (TTIs)
Our Trend Tracking Indexes (TTIs) joined the bulls and closed higher with the Domestic one showing more upward momentum.
Here’s how we closed 10/27/2017:
Domestic TTI: +3.23% (last close +2.74%)—Buy signal effective 4/4/2016
International TTI: +6.14% (last close +6.12%)—Buy signal effective 7/19/2016
Disclosure: I am obliged to inform you that I, as well as my advisory clients, own some of the ETFs listed in the above table. Furthermore, they do not represent a specific investment recommendation for you, they merely show which ETFs from the universe I track are falling within the guidelines specified.
————————————————————-
READER Q & A FOR THE WEEK
All Reader Q & A’s are listed at our web site!
Check it out at:
https://theetfbully.com/questions-answers/
———————————————————-
WOULD YOU LIKE TO HAVE YOUR INVESTMENTS PROFESSIONALLY MANAGED?
Do you have the time to follow our investment plans yourself? If you are a busy professional who would like to have his portfolio managed using our methodology, please contact me directly or get more details at:
https://theetfbully.com/personal-investment-management/
———————————————————
Back issues of the ETF/No Load Fund Tracker are available on the web at:
https://theetfbully.com/newsletter-archives/
Contact Ulli