
- Moving the Markets
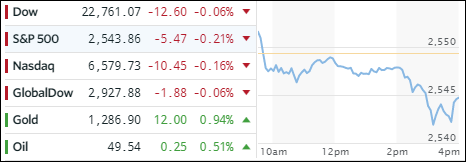
With bond markets closed today, equities lacked direction and meandered below the unchanged line with downward momentum accelerating late in the session. However, in the end, the losses for the major indexes were relatively minor.
The biggest losers were retailers, financials and healthcare, the latter of which suffered from weekend reports that Trump would seek to loosen regulations, which could lead to lower premiums. That would be a good thing for the population but a bad thing for companies’ profits.
In the ETF arena, the picture was mixed. We saw Semiconductors (SMH) outperform by gaining +0.73%, with Aerospace & Defense (ITA) logging it second place with +0.19%. Leading to the downside was US SmallCaps (SCHA) with -0.35% while MidCaps (SCHM) followed closely behind with a loss of -0.26%.
Gold had an up day, but still hovers below its $1,300 level. Oil rallied but failed to break above its $50 marker, while the US Dollar (UUP) traded in a tight range and ended up losing -0.16%.
- ETFs in the Spotlight (updated for 2017)
In case you missed the announcement and description of this section, you can read it here again.
It features 10 broadly diversified and sector ETFs from my HighVolume list as posted every Saturday. Furthermore, they are screened for the lowest MaxDD% number meaning they have been showing better resistance to temporary sell offs than all others over the past year.
The below table simply demonstrates the magnitude with which some of the ETFs are fluctuating in regards to their positions above or below their respective individual trend lines (%M/A). A break below, represented by a negative number, shows weakness, while a break above, represented by a positive percentage, shows strength.
For hundreds of ETF choices, be sure to reference Thursday’s StatSheet.
Year to date, here’s how the 2017 candidates have fared so far:
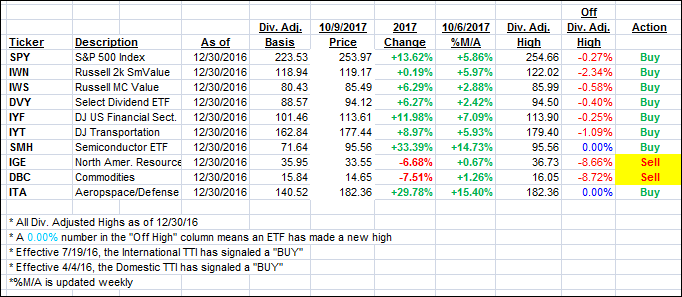
Again, the %M/A column above shows the position of the various ETFs in relation to their respective long term trend lines, while the trailing sell stops are being tracked in the “Off High” column. The “Action” column will signal a “Sell” once the -7.5% point has been taken out in the “Off High” column.
- Trend Tracking Indexes (TTIs)
Our Trend Tracking Indexes (TTIs) were mixed as the short-term trend direction was south.
Here’s how we closed 10/9/2017:
Domestic TTI: +3.03% (last close +3.09%)—Buy signal effective 4/4/2016
International TTI: +6.85% (last close +6.83%)—Buy signal effective 7/19/2016
Disclosure: I am obliged to inform you that I, as well as my advisory clients, own some of the ETFs listed in the above table. Furthermore, they do not represent a specific investment recommendation for you, they merely show which ETFs from the universe I track are falling within the guidelines specified.
Contact Ulli