
- Moving the Markets
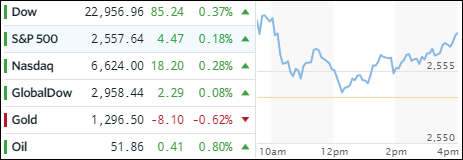
And the theme continued with the major indexes slowly but surely scoring another round of records, as the Dow closed within spitting distance of a new milestone marker, namely the 23,000 level. All of this came in anticipation that the upcoming earnings season won’t disappoint but to also confirm that the current lofty market levels are justified.
Comments from President Trump on tax cuts and healthcare issues after a meeting with Senate Majority leader McConnell did not affect markets, although the issues discussed are very critical for the continuation of bullish momentum.
Equity ETFs were a mixed bag today with a number of them ending unchanged. On the winning side of the column, we saw Semiconductors (SMH) with +0.54% and LargeCaps (SCHX) with +0.15%. Closing in the red were Transportations (IYT) and International SmallCaps (SCHC) with -0.78% and -0.30% respectively.
Interest rates rose today with the 10-year bond yield adding 2 basis points to 2.30%. Gold slumped and gave back its recently conquered $1,300 level, while crude oil gained +0.80%. The US dollar (UUP) jumped +0.25% in an effort to remain above its 50-day Moving Average, a level that was broken intra-day last Friday. The major trend remains bearish.
- ETFs in the Spotlight (updated for 2017)
In case you missed the announcement and description of this section, you can read it here again.
It features 10 broadly diversified and sector ETFs from my HighVolume list as posted every Saturday. Furthermore, they are screened for the lowest MaxDD% number meaning they have been showing better resistance to temporary sell offs than all others over the past year.
The below table simply demonstrates the magnitude with which some of the ETFs are fluctuating in regards to their positions above or below their respective individual trend lines (%M/A). A break below, represented by a negative number, shows weakness, while a break above, represented by a positive percentage, shows strength.
For hundreds of ETF choices, be sure to reference Thursday’s StatSheet.
Year to date, here’s how the 2017 candidates have fared so far:
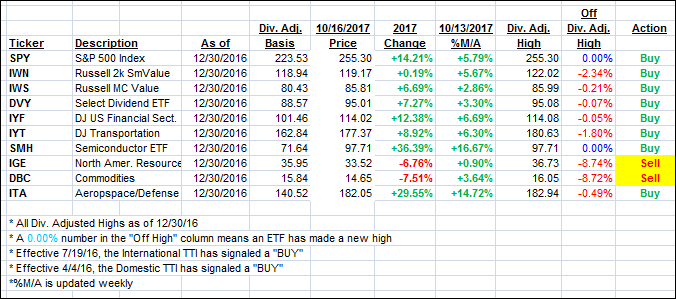
Again, the %M/A column above shows the position of the various ETFs in relation to their respective long term trend lines, while the trailing sell stops are being tracked in the “Off High” column. The “Action” column will signal a “Sell” once the -7.5% point has been taken out in the “Off High” column.
- Trend Tracking Indexes (TTIs)
Our Trend Tracking Indexes (TTIs) were mixed and changed only by a small margin:
Here’s how we closed 10/16/2017:
Domestic TTI: +3.17% (last close +3.07%)—Buy signal effective 4/4/2016
International TTI: +7.09% (last close +7.10%)—Buy signal effective 7/19/2016
Disclosure: I am obliged to inform you that I, as well as my advisory clients, own some of the ETFs listed in the above table. Furthermore, they do not represent a specific investment recommendation for you, they merely show which ETFs from the universe I track are falling within the guidelines specified.
Contact Ulli