
- Moving the Markets
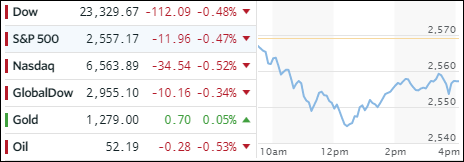
Some earnings disappointments pulled the rug out from under the major indexes causing them to drop around -0.5% across the board. The big losers were Chipotle (CMG) and AMD, which tanked -14.58% and -13.47% respectively. Also weighing on the markets were Boeing, Goldman, IBM and Caterpillar. Looking at the big picture, all S&P sectors ended in the red.
As you can see from the above chart, momentum slipped early on to a low around mid-day, after which the usual afternoon levitation started, except today it wasn’t enough to crawl back above the unchanged line. Keeping the indexes in check was the VIX, which spiked above 13, but then puked, at which time the rebound materialized.
In ETF space, the picture was similar in that green numbers were nowhere to be found. As is the case with most pullbacks, the biggest winners usually give back the most. Today was no exception as Transportations (IYT) and Semiconductors (SMH) retreated -1.52% and -1.27% respectively. Holding up the best were Emerging Markets (SCHE) with -0.22%.
Treasury yields rose again pushing the price of the 20-year bond (TLT) down by -0.48% to a low last seen in August. In other words, the 6% bond rally, which started in August, has now been completely wiped out. The US dollar (UUP) moved in a tight trading range and closed the session -0.25% lower.
- ETFs in the Spotlight (updated for 2017)
In case you missed the announcement and description of this section, you can read it here again.
It features 10 broadly diversified and sector ETFs from my HighVolume list as posted every Saturday. Furthermore, they are screened for the lowest MaxDD% number meaning they have been showing better resistance to temporary sell offs than all others over the past year.
The below table simply demonstrates the magnitude with which some of the ETFs are fluctuating in regards to their positions above or below their respective individual trend lines (%M/A). A break below, represented by a negative number, shows weakness, while a break above, represented by a positive percentage, shows strength.
For hundreds of ETF choices, be sure to reference Thursday’s StatSheet.
Year to date, here’s how the 2017 candidates have fared so far:
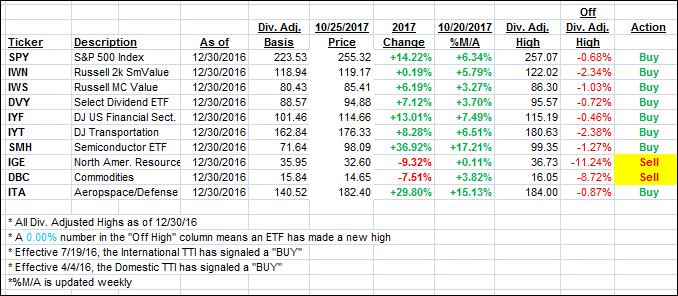
Again, the %M/A column above shows the position of the various ETFs in relation to their respective long term trend lines, while the trailing sell stops are being tracked in the “Off High” column. The “Action” column will signal a “Sell” once the -7.5% point has been taken out in the “Off High” column.
- Trend Tracking Indexes (TTIs)
Our Trend Tracking Indexes (TTIs) dropped by a small margin as the major indexes retreated.
Here’s how we closed 10/25/2017:
Domestic TTI: +2.57% (last close +2.79%)—Buy signal effective 4/4/2016
International TTI: +6.34% (last close +6.36%)—Buy signal effective 7/19/2016
Disclosure: I am obliged to inform you that I, as well as my advisory clients, own some of the ETFs listed in the above table. Furthermore, they do not represent a specific investment recommendation for you, they merely show which ETFs from the universe I track are falling within the guidelines specified.
Contact Ulli