
- Moving the Markets
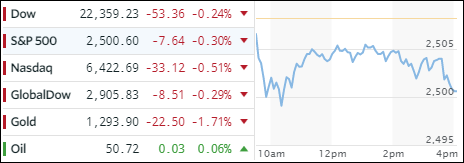
The major indexes zigzagged throughout the session but ended up on a sour note by trending towards the day’s lows. The S&P 500 managed to defend its 2,500 level successfully—so far. Not helping the bulls for the second day in a row was Apple (AAPL), which dropped another -1.72% causing the Nasdaq to surrender -0.51%.
It was the ‘morning after’ the Fed’s latest policy statement and investors were already getting nervous when news from bond market made the rounds that the Fed “may risk a misstep if it follows the current path.” That was enough to keep equities in a tight trading range all day.
On the ETF side, red numbers prevailed as well with the Dividend ETF (SCHM) faring the worst with -0.38% closely followed by the International SmallCaps (SCHC) with -0.36%. Bucking the downward trend were Aerospace & Defense (ITA) with a gain of +0.57% and Transportations (IYT) with +0.21%.
Interest rates stopped their ascent to higher levels with the 10-year bond yield slipping 1 basis point to 2.27%. Gold got hammered and lost the battle to protect its $1,300 level; at least for the time being. The US dollar (UUP) pulled back after yesterday’s large move higher by surrendering -0.29%.
- ETFs in the Spotlight (updated for 2017)
In case you missed the announcement and description of this section, you can read it here again.
It features 10 broadly diversified and sector ETFs from my HighVolume list as posted every Saturday. Furthermore, they are screened for the lowest MaxDD% number meaning they have been showing better resistance to temporary sell offs than all others over the past year.
The below table simply demonstrates the magnitude with which some of the ETFs are fluctuating in regards to their positions above or below their respective individual trend lines (%M/A). A break below, represented by a negative number, shows weakness, while a break above, represented by a positive percentage, shows strength.
For hundreds of ETF choices, be sure to reference Thursday’s StatSheet.
Year to date, here’s how the 2017 candidates have fared so far:
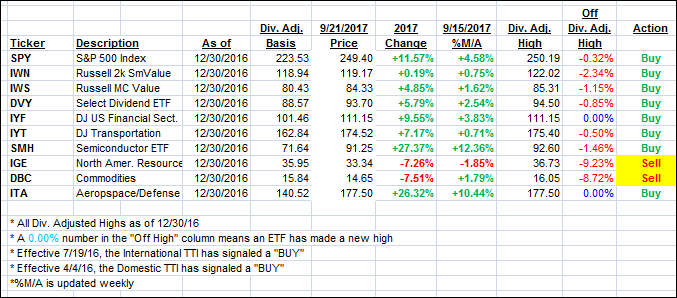
Again, the %M/A column above shows the position of the various ETFs in relation to their respective long term trend lines, while the trailing sell stops are being tracked in the “Off High” column. The “Action” column will signal a “Sell” once the -7.5% point has been taken out in the “Off High” column.
- Trend Tracking Indexes (TTIs)
Our Trend Tracking Indexes (TTIs) pulled back as the major indexes came off their highs.
Here’s how we closed 9/21/2017:
Domestic TTI: +2.64% (last close +2.79%)—Buy signal effective 4/4/2016
International TTI: +7.24% (last close +7.77%)—Buy signal effective 7/19/2016
Disclosure: I am obliged to inform you that I, as well as my advisory clients, own some of the ETFs listed in the above table. Furthermore, they do not represent a specific investment recommendation for you, they merely show which ETFs from the universe I track are falling within the guidelines specified.
Contact Ulli