
- Moving the Markets
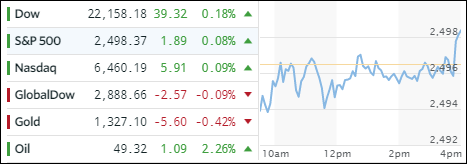
The respective unchanged lines appeared to be the magnet for the major indexes throughout most of the session, as they bounced above and below it until late buying pushed them into the green for good, and we registered another record close. The gains were tiny, but they were gains nonetheless.
As the chart above shows, upward momentum stalled and it looked like traders were searching for a catalyst to drive stocks higher. Energy (XLE) and Consumer Discretionaries (XLY) led the charge with gains of +1.27% and +0.70% respectively. Across our holdings, the Dividend ETF (SCHD) performed best with +0.21%, while the Emerging Markets (SCHE) fared the worst with -0.62% resulting in an “unchanged” condition for most of our portfolios.
Interest rates continued their recent trend reversal with the 10-bond yield crawling 3 basis points higher to 2.20%, which is quite a turnaround from the recent September lows of 2.05%. Suffering from that event is the 20-year bond ETF (TLT), which continued its slide by losing another -0.39%. The US Dollar Index (UUP) headed north by closing up +0.59%, which is not only its 3rd straight day of gains but its largest in 9 months. However, when looking at the chart, it still looks to me like a dead cat bounce.
- ETFs in the Spotlight (updated for 2017)
In case you missed the announcement and description of this section, you can read it here again.
It features 10 broadly diversified and sector ETFs from my HighVolume list as posted every Saturday. Furthermore, they are screened for the lowest MaxDD% number meaning they have been showing better resistance to temporary sell offs than all others over the past year.
The below table simply demonstrates the magnitude with which some of the ETFs are fluctuating in regards to their positions above or below their respective individual trend lines (%M/A). A break below, represented by a negative number, shows weakness, while a break above, represented by a positive percentage, shows strength.
For hundreds of ETF choices, be sure to reference Thursday’s StatSheet.
Year to date, here’s how the 2017 candidates have fared so far:
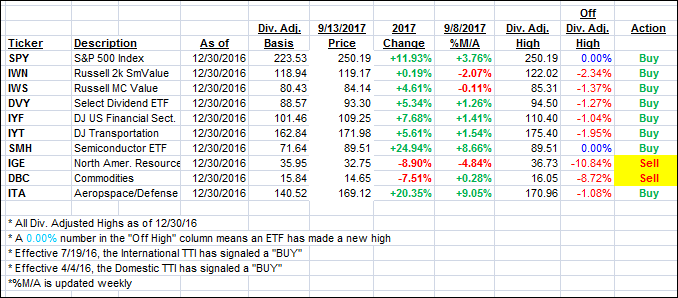
Again, the %M/A column above shows the position of the various ETFs in relation to their respective long term trend lines, while the trailing sell stops are being tracked in the “Off High” column. The “Action” column will signal a “Sell” once the -7.5% point has been taken out in the “Off High” column.
- Trend Tracking Indexes (TTIs)
Our Trend Tracking Indexes (TTIs) changed immaterially as the intra-trend went sideways for the session.
Here’s how we closed 9/13/2017:
Domestic TTI: +2.86% (last close +2.91%)—Buy signal effective 4/4/2016
International TTI: +7.08% (last close +7.35%)—Buy signal effective 7/19/2016
Disclosure: I am obliged to inform you that I, as well as my advisory clients, own some of the ETFs listed in the above table. Furthermore, they do not represent a specific investment recommendation for you, they merely show which ETFs from the universe I track are falling within the guidelines specified.
Contact Ulli