
- Moving the Markets
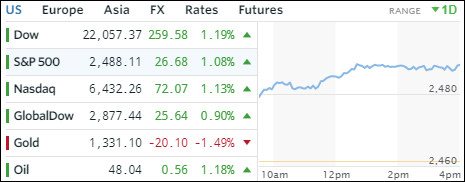
Sure, why not? After hurricane Harvey’s strike in Texas, which is still trying to get a handle on the amount of devastation and costs to rebuild, Irma struck Florida this weekend wreaking havoc in many parts, but the hit turned out to be less forceful than expected. That fact, combined with N. Korea failing to conduct another missile test, was the enough to send stocks sharply higher with the Dow notching its biggest gain in 6 months.
It did not matter that some 6 million people are without power, and the damage caused may end up being the worst disaster in American history, equities soared, and the major indexes all scored in excess of 1% and never looked back after a huge opening gap.
Leading the charge among our most widely held ETFs were Semiconductors (SMH) with +1.82% followed by Aerospace & Defense (ITA) and Emerging Markets (SCHE) gaining +1.15% and 1.14% respectively. All others closed in the green as well with the laggard being International SmallCaps (SCHC) adding only +0.32%.
Interest rates rose, bucking their 2-month downtrend with the 10-year bond yield gaining 8 basis points to close at 2.14%. As a result, the 20-year bond gave back some of its recent profits by losing -1.19%. The US Dollar index (UUP) bounced for a change and recovered +0.68%. With “risk” being on, at least for the day, and all worries being shoved aside, gold retreated at the tune of -1.15%.
- ETFs in the Spotlight (updated for 2017)
In case you missed the announcement and description of this section, you can read it here again.
It features 10 broadly diversified and sector ETFs from my HighVolume list as posted every Saturday. Furthermore, they are screened for the lowest MaxDD% number meaning they have been showing better resistance to temporary sell offs than all others over the past year.
The below table simply demonstrates the magnitude with which some of the ETFs are fluctuating in regards to their positions above or below their respective individual trend lines (%M/A). A break below, represented by a negative number, shows weakness, while a break above, represented by a positive percentage, shows strength.
For hundreds of ETF choices, be sure to reference Thursday’s StatSheet.
Year to date, here’s how the 2017 candidates have fared so far:
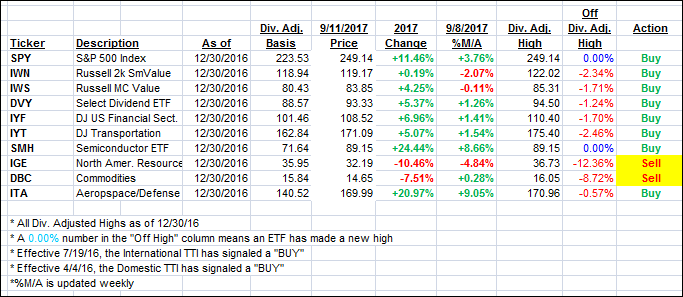
Again, the %M/A column above shows the position of the various ETFs in relation to their respective long term trend lines, while the trailing sell stops are being tracked in the “Off High” column. The “Action” column will signal a “Sell” once the -7.5% point has been taken out in the “Off High” column.
- Trend Tracking Indexes (TTIs)
Our Trend Tracking Indexes (TTIs) bounced as the major indexes railed right out of the starting gate and never looked back.
Here’s how we closed 9/11/2017:
Domestic TTI: +2.82% (last close +2.46%)—Buy signal effective 4/4/2016
International TTI: +6.92% (last close +6.29%)—Buy signal effective 7/19/2016
Disclosure: I am obliged to inform you that I, as well as my advisory clients, own some of the ETFs listed in the above table. Furthermore, they do not represent a specific investment recommendation for you, they merely show which ETFs from the universe I track are falling within the guidelines specified.
Contact Ulli