
- Moving the Markets
A host of events joined forces to keep equities in a state of uncertainty. It started with an ugly jobs data report showing that jobless claims spiked the most in 12 years, in part due to hurricane Harvey’s economic effects many of which are still unknown. Not helping matters was the announcement that Q2 saw labor costs decline -0.2% YoY, meaning they have been unchanged since 2015 and income gains are simply an illusion.
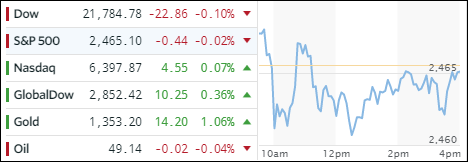
Financials (XLF) got hit hard today and lost -1.73% with the Regional Banking ETF (KBWR) dropping -2.62%. On the equity side, we saw the International SmallCaps (SCHC) take top billing with +1.08% followed by the Internationals (SCHF) with +0.80%. Ending the day in the red were domestic SmallCaps (SCHA) with a modest -0.28% loss.
With all of the official rhetoric spewed in MSM as to how great the economy is doing, I have to ask: If that is so, why are interest rates collapsing? They should be rising instead. The 10-year Bond yield slipped again by 5 basis points to end the day at 2.05%; which is the lowest level of the year. It looks as though the 2% level may be taken out in the near future to bring us back to where we were at election time. In other words, the Trump pump effect on interest rates has been wiped out. Will equities follow?
The US Dollar (UUP) plunged by -1.33% and has not only been making a new low for the year but also reached a point last seen in December 2014. It has clearly broken its 200-day M/A to the downside and is stuck in bear market territory. On the plus side, gold is heading solidly north and has conquered its $1,350 marker for the first time since July 2016.
- ETFs in the Spotlight (updated for 2017)
In case you missed the announcement and description of this section, you can read it here again.
It features 10 broadly diversified and sector ETFs from my HighVolume list as posted every Saturday. Furthermore, they are screened for the lowest MaxDD% number meaning they have been showing better resistance to temporary sell offs than all others over the past year.
The below table simply demonstrates the magnitude with which some of the ETFs are fluctuating in regards to their positions above or below their respective individual trend lines (%M/A). A break below, represented by a negative number, shows weakness, while a break above, represented by a positive percentage, shows strength.
For hundreds of ETF choices, be sure to reference Thursday’s StatSheet.
Year to date, here’s how the 2017 candidates have fared so far:
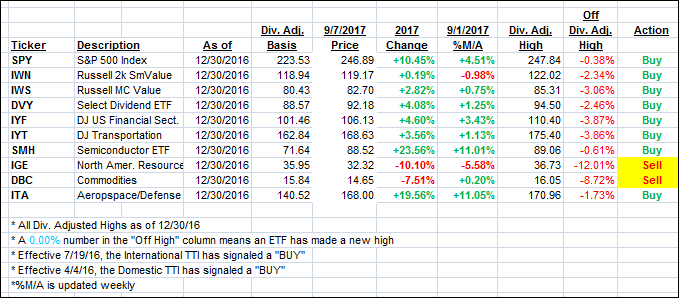
Again, the %M/A column above shows the position of the various ETFs in relation to their respective long term trend lines, while the trailing sell stops are being tracked in the “Off High” column. The “Action” column will signal a “Sell” once the -7.5% point has been taken out in the “Off High” column.
- Trend Tracking Indexes (TTIs)
Our Trend Tracking Indexes (TTIs) both ended higher with the International one showing more spunk.
Here’s how we closed 9/7/2017:
Domestic TTI: +2.70% (last close +2.65%)—Buy signal effective 4/4/2016
International TTI: +6.49% (last close +5.89%)—Buy signal effective 7/19/2016
Disclosure: I am obliged to inform you that I, as well as my advisory clients, own some of the ETFs listed in the above table. Furthermore, they do not represent a specific investment recommendation for you, they merely show which ETFs from the universe I track are falling within the guidelines specified.
Contact Ulli