
- Moving the Markets
In addition to the usual menu of concerns, there were a few new ones that helped the markets end their multi-day winning streak. Besides the lack of progress with the Trump pro-growth agenda and continued saber rattling with N. Korea, another monster hurricane named Irma is threatening the coast of Florida prompting the state to prepare for the “catastrophic” system.
In the meantime, on the economic side, July factory orders plunged to their weakest since February with final data confirming a 3.3 MoM tumble; durable goods got spanked at a rate of -6.8%. Ouch!
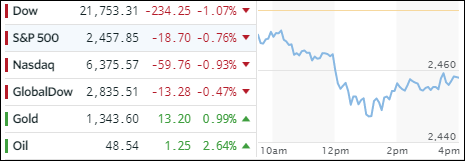
As a result, the major indexes headed south with the S&P 500 faring the best by surrendering only -0.76%. Across the ETF spectrum, Semiconductors (SMH) gave back -1.27% closely followed by Transportations (IYT) with -0.97%. The Dividend ETF (SCHD) held up the best with -0.44%.
Profiting from all this carnage were Gold and Bonds. As is well-known, gold can be an insurance play, and it certainly acted that way today with a gain of +0.99% and a sprint towards the $1,350 marker, a level last seen in September 2016. In regards to interest rates, yields got clobbered with the 10-year losing 6 basis points to end the day at 2.10%.
That benefited the 20-year bond (TLT), which rallied a solid +1.54% and continued its northerly path from August.
The US Dollar (UUP) retraced some of its recent gains, AKA a dead cat bounce, and dropped -0.54%.
- ETFs in the Spotlight (updated for 2017)
In case you missed the announcement and description of this section, you can read it here again.
It features 10 broadly diversified and sector ETFs from my HighVolume list as posted every Saturday. Furthermore, they are screened for the lowest MaxDD% number meaning they have been showing better resistance to temporary sell offs than all others over the past year.
The below table simply demonstrates the magnitude with which some of the ETFs are fluctuating in regards to their positions above or below their respective individual trend lines (%M/A). A break below, represented by a negative number, shows weakness, while a break above, represented by a positive percentage, shows strength.
For hundreds of ETF choices, be sure to reference Thursday’s StatSheet.
Year to date, here’s how the 2017 candidates have fared so far:
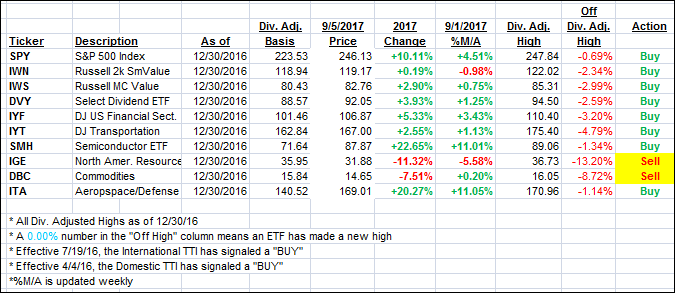
Again, the %M/A column above shows the position of the various ETFs in relation to their respective long term trend lines, while the trailing sell stops are being tracked in the “Off High” column. The “Action” column will signal a “Sell” once the -7.5% point has been taken out in the “Off High” column.
- Trend Tracking Indexes (TTIs)
Our Trend Tracking Indexes (TTIs) followed the major indexes south.
Here’s how we closed 9/5/2017:
Domestic TTI: +2.56% (last close +2.81%)—Buy signal effective 4/4/2016
International TTI: +5.75% (last close +6.13%)—Buy signal effective 7/19/2016
Disclosure: I am obliged to inform you that I, as well as my advisory clients, own some of the ETFs listed in the above table. Furthermore, they do not represent a specific investment recommendation for you, they merely show which ETFs from the universe I track are falling within the guidelines specified.
Contact Ulli