
- Moving the Markets
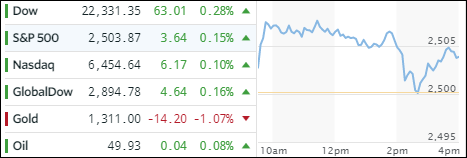
Despite sudden market weakness developing late in the session, with technology and biotech being spooked the most, the major indexes recovered a good chunk of their early gains and ended in the green with the Dow notching its 40th record close of the year. Helping matters were reduced tensions between N. Korea and the U.S. over the weekend.
In ETF space, Transportations (IYT) came roaring back and added a solid +2.21%. Taking second place with +1.74% was the Aerospace & Defense ETF (ITA) while Semiconductors (SMH) gained +1.39%. On the downside, the Dividend ETF (SCHD) suffered a -0.51% loss.
Gold retreated as well as interest rates rose with 10-year bond yield spiking 3 basis points to 2.23%. As a result, the 20-year Bond (TLT) lost -0.58%. The current slide in rates, which started the beginning of July and hit a low of 2.05% for the 10-year bond early September, appears to have reversed, but it’s too early to tell if it’s just a dead cat bounce or the beginning of a new major uptrend. The US dollar (UUP) followed suit and gained +0.25%.
- ETFs in the Spotlight (updated for 2017)
In case you missed the announcement and description of this section, you can read it here again.
It features 10 broadly diversified and sector ETFs from my HighVolume list as posted every Saturday. Furthermore, they are screened for the lowest MaxDD% number meaning they have been showing better resistance to temporary sell offs than all others over the past year.
The below table simply demonstrates the magnitude with which some of the ETFs are fluctuating in regards to their positions above or below their respective individual trend lines (%M/A). A break below, represented by a negative number, shows weakness, while a break above, represented by a positive percentage, shows strength.
For hundreds of ETF choices, be sure to reference Thursday’s StatSheet.
Year to date, here’s how the 2017 candidates have fared so far:
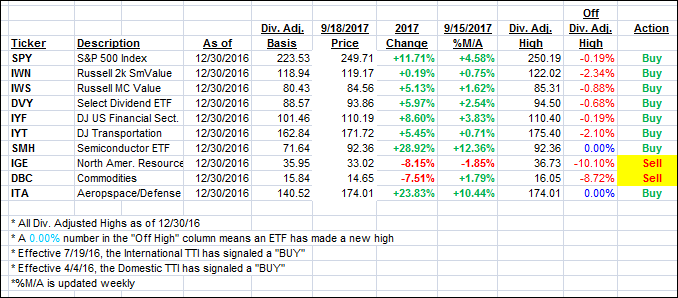
Again, the %M/A column above shows the position of the various ETFs in relation to their respective long term trend lines, while the trailing sell stops are being tracked in the “Off High” column. The “Action” column will signal a “Sell” once the -7.5% point has been taken out in the “Off High” column.
- Trend Tracking Indexes (TTIs)
Our Trend Tracking Indexes (TTIs) climbed as the mood among traders was predominantly bullish.
Here’s how we closed 9/18/2017:
Domestic TTI: +2.78% (last close +2.69%)—Buy signal effective 4/4/2016
International TTI: +7.07% (last close +6.85%)—Buy signal effective 7/19/2016
Disclosure: I am obliged to inform you that I, as well as my advisory clients, own some of the ETFs listed in the above table. Furthermore, they do not represent a specific investment recommendation for you, they merely show which ETFs from the universe I track are falling within the guidelines specified.
Contact Ulli