
- Moving the Markets
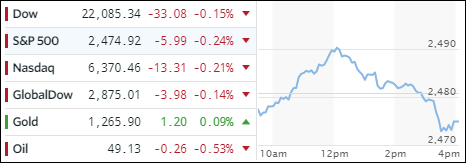
The major indexes did their customary morning dip and then started to recover to cross solidly above their respective unchanged lines. Hedge fund heavyweight Jeff Gundlach’s market warnings were offset somewhat by the usual VIX beating to keep the Dow winning streak alive. However, Trump’s “Fire and Fury” speech directed towards North Korea took the starch out of upward momentum and south we went, as the chart above shows.
Winning big time, prior to Trump’s speech, were the Seminconductors (SMH) with +2.75%, a gain that disappeared in a hurry and turned into a -0.30% loss, pretty much in line with the percentages the broader indexes gave back. Volatility showed signs of life with the VIX storming out of the basement to close above 11. That caused the FANG stocks to take a dive, and they gave back yesterday’s gains.
Gold was able to buck the trend by closing in the green, as did the Emerging Markets (SCHE) with +0.19%. Interest rates rose with the 10-year yield adding 3 basis points to close at 2.29%. Yes, with rising geopolitical tensions, you might have expected rates to fall, but they didn’t. The US Dollar (UUP) bounced around, traded in a wide range and settled +0.17% higher.
- ETFs in the Spotlight (updated for 2017)
In case you missed the announcement and description of this section, you can read it here again.
It features 10 broadly diversified and sector ETFs from my HighVolume list as posted every Saturday. Furthermore, they are screened for the lowest MaxDD% number meaning they have been showing better resistance to temporary sell offs than all others over the past year.
The below table simply demonstrates the magnitude with which some of the ETFs are fluctuating in regards to their positions above or below their respective individual trend lines (%M/A). A break below, represented by a negative number, shows weakness, while a break above, represented by a positive percentage, shows strength.
For hundreds of ETF choices, be sure to reference Thursday’s StatSheet.
Year to date, here’s how the 2017 candidates have fared so far:
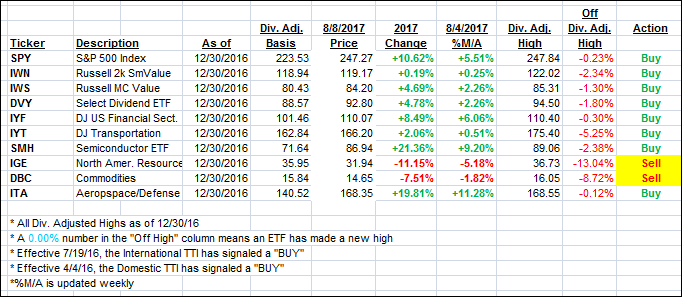
Again, the %M/A column above shows the position of the various ETFs in relation to their respective long term trend lines, while the trailing sell stops are being tracked in the “Off High” column. The “Action” column will signal a “Sell” once the -7.5% point has been taken out in the “Off High” column.
- Trend Tracking Indexes (TTIs)
Our Trend Tracking Indexes (TTIs) gave back a tad as the roller coaster ride was in full swing today.
Here’s how we closed 8/8/2017:
Domestic TTI: +3.09% (last close +3.15%)—Buy signal effective 4/4/2016
International TTI: +7.92% (last close +8.09%)—Buy signal effective 7/19/2016
Disclosure: I am obliged to inform you that I, as well as my advisory clients, own some of the ETFs listed in the above table. Furthermore, they do not represent a specific investment recommendation for you, they merely show which ETFs from the universe I track are falling within the guidelines specified.
Contact Ulli