
- Moving the Markets
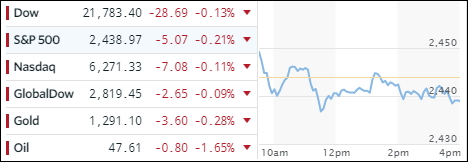
Even though the day started on the plus side for the major indexes, early upward momentum was not sustainable as miserable housing data, for the second day in a row, gave the bears something to cheer about. Uncertainty continued as the debt-ceiling-battle between Trump and McConnell showed no compromise and threw doubt on an amicable solution. And last not least, the energy complex tuned chaotic with Hurricane Harvey threatening to near landfall.
In the end, the major indexes ended up vacillating tightly around the unchanged line and closing slightly below it. Slipping the most were Transportations (IYT) with -0.64%. On the plus side, Emerging Markets (SCHE) added +0.34% while SmallCaps (SCHA) gained +0.18%.
With uncertainty keeping a leash on any market advances, bonds slipped with the 20-year T-Bond (TLT) losing -0.37%. The US dollar (UUP) traded in a tight range and ended higher by +0.21%. Gold dropped a tad and remains in a tight trading range just below its $1,300 milestone marker.
- ETFs in the Spotlight (updated for 2017)
In case you missed the announcement and description of this section, you can read it here again.
It features 10 broadly diversified and sector ETFs from my HighVolume list as posted every Saturday. Furthermore, they are screened for the lowest MaxDD% number meaning they have been showing better resistance to temporary sell offs than all others over the past year.
The below table simply demonstrates the magnitude with which some of the ETFs are fluctuating in regards to their positions above or below their respective individual trend lines (%M/A). A break below, represented by a negative number, shows weakness, while a break above, represented by a positive percentage, shows strength.
For hundreds of ETF choices, be sure to reference Thursday’s StatSheet.
Year to date, here’s how the 2017 candidates have fared so far:
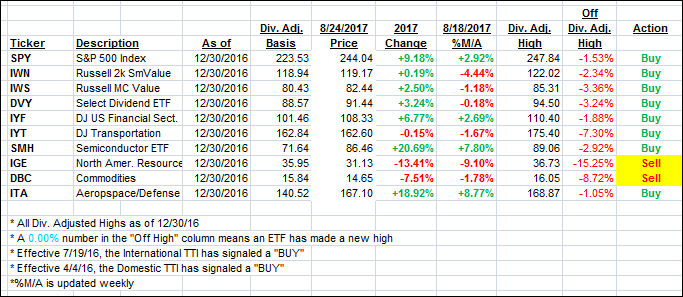
Again, the %M/A column above shows the position of the various ETFs in relation to their respective long term trend lines, while the trailing sell stops are being tracked in the “Off High” column. The “Action” column will signal a “Sell” once the -7.5% point has been taken out in the “Off High” column.
- Trend Tracking Indexes (TTIs)
Our Trend Tracking Indexes (TTIs) slipped a tad as uncertainty about the debt ceiling reigned supreme.
Here’s how we closed 8/24/2017:
Domestic TTI: +2.31% (last close +2.41%)—Buy signal effective 4/4/2016
International TTI: +6.06% (last close +6.16%)—Buy signal effective 7/19/2016
Disclosure: I am obliged to inform you that I, as well as my advisory clients, own some of the ETFs listed in the above table. Furthermore, they do not represent a specific investment recommendation for you, they merely show which ETFs from the universe I track are falling within the guidelines specified.
Contact Ulli