
- Moving the Markets
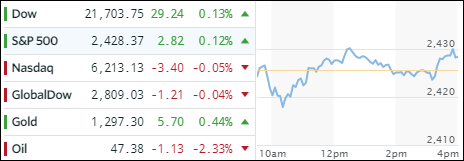
It was another session during which the major indexes danced around their respective unchanged lines. Early losses were wiped out for the most part, and we managed to eke out a tiny gain with the exception of the Nasdaq, which closed slightly in the red.
In the ETF spectrum that we are invested in, Transportations (IYT) took the lead with +0.40%, followed by the Dividend ETF (SCHD), which added +0.33%. Lagging behind, but ending the day in the green, were the International SmallCaps (SCHC) with +0.15% and International Equities (SCHF) with +0.06%. With the Nasdaq showing weakness, it’s no surprise that Semiconductors (SMH) ended down -0.37%.
Low volume marked the session and added to the aimless meandering, which also found support from continued geopolitical tensions and political turmoil in Washington. The bulls remained cautious and defensive sectors benefited. Gold was one of those areas, and the shiny metal is again knocking against its $1,300 glass ceiling for the third time this year.
The 10-year bond yield dropped again and has now reached a level last seen in June. It’s a clear sign that economically speaking things may not be what they appear as presented in MSM. The US Dollar (UUP) had recently bounced off the August 1 lows, but seems to have resumed the downtrend and is now approaching that low from above. On the weekly chart, it has now also broken his 200-day M/A, which has not happened since August 2014. It looks to be a bear market in the making.
- ETFs in the Spotlight (updated for 2017)
In case you missed the announcement and description of this section, you can read it here again.
It features 10 broadly diversified and sector ETFs from my HighVolume list as posted every Saturday. Furthermore, they are screened for the lowest MaxDD% number meaning they have been showing better resistance to temporary sell offs than all others over the past year.
The below table simply demonstrates the magnitude with which some of the ETFs are fluctuating in regards to their positions above or below their respective individual trend lines (%M/A). A break below, represented by a negative number, shows weakness, while a break above, represented by a positive percentage, shows strength.
For hundreds of ETF choices, be sure to reference Thursday’s StatSheet.
Year to date, here’s how the 2017 candidates have fared so far:
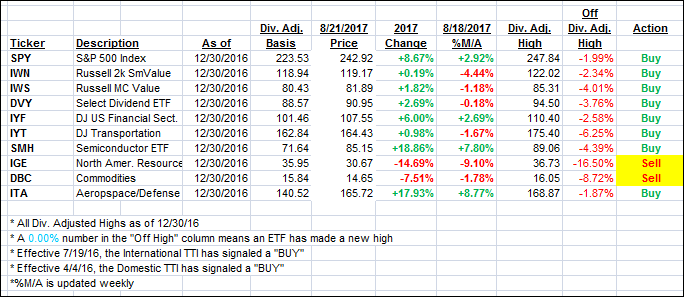
Again, the %M/A column above shows the position of the various ETFs in relation to their respective long term trend lines, while the trailing sell stops are being tracked in the “Off High” column. The “Action” column will signal a “Sell” once the -7.5% point has been taken out in the “Off High” column.
- Trend Tracking Indexes (TTIs)
Our Trend Tracking Indexes (TTIs) were pretty much dormant.
Here’s how we closed 8/21/2017:
Domestic TTI: +2.14% (last close +2.10%)—Buy signal effective 4/4/2016
International TTI: +5.63% (last close +5.63%)—Buy signal effective 7/19/2016
Disclosure: I am obliged to inform you that I, as well as my advisory clients, own some of the ETFs listed in the above table. Furthermore, they do not represent a specific investment recommendation for you, they merely show which ETFs from the universe I track are falling within the guidelines specified.
Contact Ulli