
- Moving the Markets
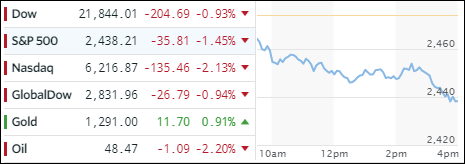
The war drums with N. Korea were beating louder today as the high octane rhetoric was turned up a notch with a “preemptive strike” headline and similar dialogues pulling stocks down for the 3rd consecutive day. The session ended with the major indexes at their lows, which will make for an interesting opening tomorrow. If you find the news confusing, you might want to read a right-to-the-point article from the Ron Paul Institute here.
ZH summed the day up best:
- Nasdaq, Dow, S&P, Small Caps worst day in 3 months (to one month lows)
- S&P Tech Sector worst day in 2 months
- Financials worst day in 3 months
- HYG (HY Bond) worst 3-day move in 5 months (to lowest since March)
- VIX biggest 3-day spike since Aug 2015 China devaluation
- Gold’s best 3-day rally in 3 months
- Yuan biggest 3-day gain in 2 months
Of course, should this war mongering talk end up being a nothing burger, we could see a gigantic rally back towards record territory, but it’s too early to tell. For the time being, volatility shot up with the S&P VIX banging through its 200 day M/A and closing at 16, which is quite a jump from its recent low of around 8 and is its highest price since the election.
To no surprise, gold had another good day and surged to a 2-month high. This level of uncertainly had Wall Street traders move into bonds causing interest rates to drop thereby allowing the 20-year bond TLT to rally +0.85%. The US Dollar (UUP) held up fairly well and gave back only a modest -0.17%. Please see section 3 below as to the affect on our Trend Tracking Indexes (TTIs).
- ETFs in the Spotlight (updated for 2017)
In case you missed the announcement and description of this section, you can read it here again.
It features 10 broadly diversified and sector ETFs from my HighVolume list as posted every Saturday. Furthermore, they are screened for the lowest MaxDD% number meaning they have been showing better resistance to temporary sell offs than all others over the past year.
The below table simply demonstrates the magnitude with which some of the ETFs are fluctuating in regards to their positions above or below their respective individual trend lines (%M/A). A break below, represented by a negative number, shows weakness, while a break above, represented by a positive percentage, shows strength.
For hundreds of ETF choices, be sure to reference Thursday’s StatSheet.
Year to date, here’s how the 2017 candidates have fared so far:
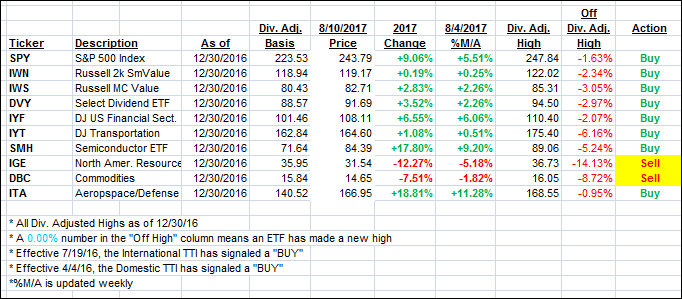
Again, the %M/A column above shows the position of the various ETFs in relation to their respective long term trend lines, while the trailing sell stops are being tracked in the “Off High” column. The “Action” column will signal a “Sell” once the -7.5% point has been taken out in the “Off High” column.
- Trend Tracking Indexes (TTIs)
Our Trend Tracking Indexes (TTIs) took a dive but remain on the bullish side of their respective trend lines. Additionally, none of our predetermined sell stops were triggered.
Here’s how we closed 8/10/2017:
Domestic TTI: +2.38% (last close +3.03%)—Buy signal effective 4/4/2016
International TTI: +6.31% (last close +7.36%)—Buy signal effective 7/19/2016
Disclosure: I am obliged to inform you that I, as well as my advisory clients, own some of the ETFs listed in the above table. Furthermore, they do not represent a specific investment recommendation for you, they merely show which ETFs from the universe I track are falling within the guidelines specified.
Contact Ulli