
- Moving the Markets
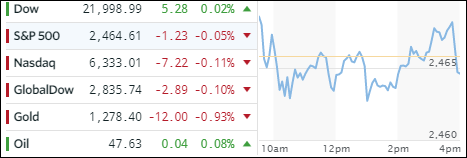
Equities struggled all day to find some direction, but the session turned out to be nothing but aimless meandering around the unchanged line with the major indexes essentially remaining unchanged.
SmallCaps (SCHA) fared the worst with a loss of -0.68% closely followed by MidCaps (SCHM) giving back -0.31%. On the winning side, semiconductors (SMH) added +0.37%, despite the Nasdaq’s weak showing, and Transportations (IYT) notched a gain of +0.29%. The Dow had an interesting day with Boeing and Apple adding 30 points, while Home Depot’s -3.2% pounding took 30 points away leaving the index with a tiny gain of +0.02%.
Retailers crashed again as the Retail Apocalypse continued with XRT not just dropping -2.70% to a level last seen early July but also clearly breaking its 50-day M/A to the downside. If this current critical support is taken out as well, we’d be looking at lows last seen in 2013.
Interest rates spiked, and the 20-year T-bond lost -0.42%; gold dumped and the US dollar pumped for a change. UUP gapped higher and whipsawed throughout the session but ended up by +0.45%.
- ETFs in the Spotlight (updated for 2017)
In case you missed the announcement and description of this section, you can read it here again.
It features 10 broadly diversified and sector ETFs from my HighVolume list as posted every Saturday. Furthermore, they are screened for the lowest MaxDD% number meaning they have been showing better resistance to temporary sell offs than all others over the past year.
The below table simply demonstrates the magnitude with which some of the ETFs are fluctuating in regards to their positions above or below their respective individual trend lines (%M/A). A break below, represented by a negative number, shows weakness, while a break above, represented by a positive percentage, shows strength.
For hundreds of ETF choices, be sure to reference Thursday’s StatSheet.
Year to date, here’s how the 2017 candidates have fared so far:
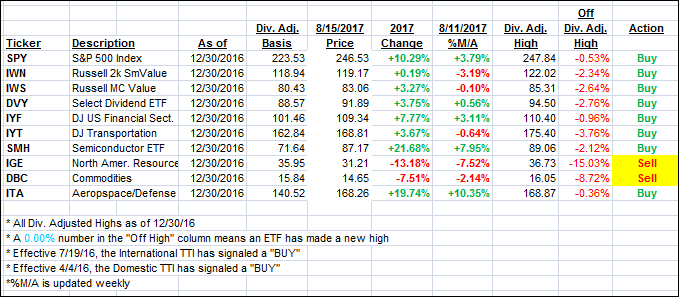
Again, the %M/A column above shows the position of the various ETFs in relation to their respective long term trend lines, while the trailing sell stops are being tracked in the “Off High” column. The “Action” column will signal a “Sell” once the -7.5% point has been taken out in the “Off High” column.
- Trend Tracking Indexes (TTIs)
Our Trend Tracking Indexes (TTIs) went nowhere during this directionless session.
Here’s how we closed 8/15/2017:
Domestic TTI: +2.77% (last close +2.81%)—Buy signal effective 4/4/2016
International TTI: +6.46% (last close +6.47%)—Buy signal effective 7/19/2016
Disclosure: I am obliged to inform you that I, as well as my advisory clients, own some of the ETFs listed in the above table. Furthermore, they do not represent a specific investment recommendation for you, they merely show which ETFs from the universe I track are falling within the guidelines specified.
Contact Ulli