
- Moving the Markets
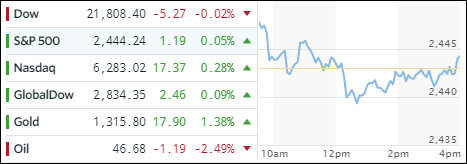
While Hurricane Harvey unleashed his enormous power over the weekend, the major indexes escaped pretty much unscathed and spent the session bouncing around their respective unchanged lines. The Nasdaq fared the best by gaining +0.28%. Retailers, along with the energy and financial sectors, slid early on but were not able to stage a bounce back later in the session.
Across our most widely tracked ETFs, Transportations (IYT) took 1st place with +0.35%, which was closely followed by Semiconductors (SMH) with a gain of +0.29%. On the losing side, MidCaps (SCHM) gave back -0.21%, while Dividend ETFs (SCHD) surrendered a tiny -0.11%.
Interest rates dropped a tad, but it wasn’t enough to push the 20-year bond (TLT) higher, instead, it lost -0.06%. To no surprise, with uncertainty caused by hurricane Harvey, gold was the beneficiary by gaining +1.38% to finally conquer its $1,300 milestone marker reaching a level last seen in October 2016. The US dollar (UUP) continued its bearish path for the year by making new lows and reaching a price point that we have not encountered since November 2014.
- ETFs in the Spotlight (updated for 2017)
In case you missed the announcement and description of this section, you can read it here again.
It features 10 broadly diversified and sector ETFs from my HighVolume list as posted every Saturday. Furthermore, they are screened for the lowest MaxDD% number meaning they have been showing better resistance to temporary sell offs than all others over the past year.
The below table simply demonstrates the magnitude with which some of the ETFs are fluctuating in regards to their positions above or below their respective individual trend lines (%M/A). A break below, represented by a negative number, shows weakness, while a break above, represented by a positive percentage, shows strength.
For hundreds of ETF choices, be sure to reference Thursday’s StatSheet.
Year to date, here’s how the 2017 candidates have fared so far:
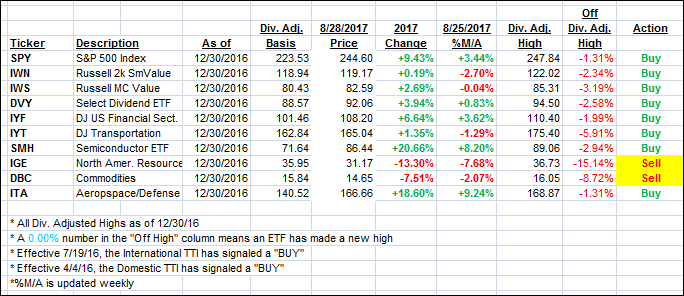
Again, the %M/A column above shows the position of the various ETFs in relation to their respective long term trend lines, while the trailing sell stops are being tracked in the “Off High” column. The “Action” column will signal a “Sell” once the -7.5% point has been taken out in the “Off High” column.
- Trend Tracking Indexes (TTIs)
Our Trend Tracking Indexes (TTIs) barely moved as the indexes were clinging tightly to their respective unchanged lines.
Here’s how we closed 8/28/2017:
Domestic TTI: +2.28% (last close +2.20%)—Buy signal effective 4/4/2016
International TTI: +5.97% (last close +5.98%)—Buy signal effective 7/19/2016
Disclosure: I am obliged to inform you that I, as well as my advisory clients, own some of the ETFs listed in the above table. Furthermore, they do not represent a specific investment recommendation for you, they merely show which ETFs from the universe I track are falling within the guidelines specified.
Contact Ulli