
- Moving the Markets
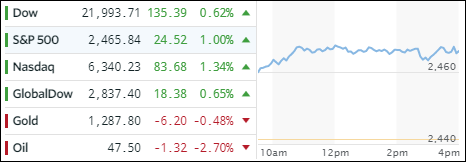
With the geopolitical tensions having been pushed hard by the MSM (Main Stream Media) last week, it’s no surprise that after the incessant jawboning waned, dip buyers appeared to ramp the indexes back towards their recent highs. The Dow turned out to be today’s laggard while the S&P 500 and Nasdaq gained solidly and also reclaimed their respective 50-day M/As.
Sure, while stability returned for this session, it should be clear that things could change in a hurry either via a well-timed tweet or a challenging headline. Across the ETF spectrum, semiconductors (SMH) took the lead with +1.97%, which was closely followed by Transportations’ (IYT) +1.77% and then SmallCaps (SCHA), which gained +1.31%. However, we still remain below last week’s level reached before Trump’s “fire and fury” speech.
Gold and Bonds slumped with the 20-year T-Bond (TLT) losing -0.51%, as risk (equities) went back into “on” mode after last week’s pullback. The VIX tumbled as volatility subsided, at least for the day. So did Crude Oil with -2.70%. Recovering a bit from last week’s drubbing was the US dollar (UUP) which bounced back +0.41%.
- ETFs in the Spotlight (updated for 2017)
In case you missed the announcement and description of this section, you can read it here again.
It features 10 broadly diversified and sector ETFs from my HighVolume list as posted every Saturday. Furthermore, they are screened for the lowest MaxDD% number meaning they have been showing better resistance to temporary sell offs than all others over the past year.
The below table simply demonstrates the magnitude with which some of the ETFs are fluctuating in regards to their positions above or below their respective individual trend lines (%M/A). A break below, represented by a negative number, shows weakness, while a break above, represented by a positive percentage, shows strength.
For hundreds of ETF choices, be sure to reference Thursday’s StatSheet.
Year to date, here’s how the 2017 candidates have fared so far:
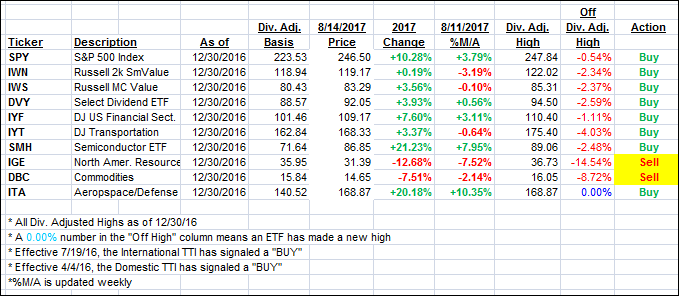
Again, the %M/A column above shows the position of the various ETFs in relation to their respective long term trend lines, while the trailing sell stops are being tracked in the “Off High” column. The “Action” column will signal a “Sell” once the -7.5% point has been taken out in the “Off High” column.
- Trend Tracking Indexes (TTIs)
Our Trend Tracking Indexes (TTIs) improved and headed north as the bulls were in charge.
Here’s how we closed 8/14/2017:
Domestic TTI: +2.81% (last close +2.42%)—Buy signal effective 4/4/2016
International TTI: +6.47% (last close +5.87%)—Buy signal effective 7/19/2016
Disclosure: I am obliged to inform you that I, as well as my advisory clients, own some of the ETFs listed in the above table. Furthermore, they do not represent a specific investment recommendation for you, they merely show which ETFs from the universe I track are falling within the guidelines specified.
Contact Ulli