
- Moving the Markets
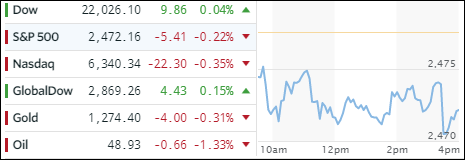
The broader market, weighed down by a slumping energy sector (-1.43%), simply could not keep up with the Dow, which notched its seventh consecutive all-time high, although by only the slightest of margins. Not helping the bulls was the fact that the US services economy presented a mixed picture as one component (PMI) came in at a 6-month high, while the other one (ISM) collapsed to 11-month lows. So you decide if this was good or bad…
Crude Oil took another hit but the Transportation Index (IYT) showed signs of life and rebounded +0.41%. Aerospace and Defense (ITA) joined in and gained +0.73%. Across the equity ETF spectrum, only the Dividend ETF (SCHD) managed to close in the green by adding +0.17%. SmallCaps (SCHA) not only lost -0.37% but also dropped below their 50-day M/A, which, when compared to the Dow makes sense in that SmallCaps get most of their revenues from domestic operations as opposed to a handful of Dow names generating most of their monies overseas.
This diversion of the Dow outperforming the rest of the market, especially with Transports having headed south over the past few weeks, could be the first sign of a slowing uptrend. The second one being weakness in SmallCaps as we enter the seasonally fragile August/September period.
Interest rates tumbled allowing the 20-bond (TLT) to score a nice gain of +1.03%. The US Dollar index (UUP) knee jerked and closed down losing another -0.25%.
- ETFs in the Spotlight (updated for 2017)
In case you missed the announcement and description of this section, you can read it here again.
It features 10 broadly diversified and sector ETFs from my HighVolume list as posted every Saturday. Furthermore, they are screened for the lowest MaxDD% number meaning they have been showing better resistance to temporary sell offs than all others over the past year.
The below table simply demonstrates the magnitude with which some of the ETFs are fluctuating in regards to their positions above or below their respective individual trend lines (%M/A). A break below, represented by a negative number, shows weakness, while a break above, represented by a positive percentage, shows strength.
For hundreds of ETF choices, be sure to reference Thursday’s StatSheet.
Year to date, here’s how the 2017 candidates have fared so far:
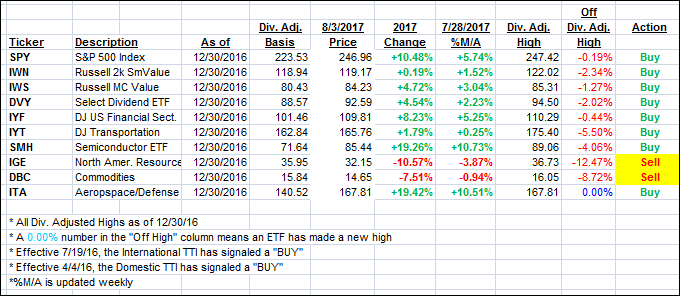
Again, the %M/A column above shows the position of the various ETFs in relation to their respective long term trend lines, while the trailing sell stops are being tracked in the “Off High” column. The “Action” column will signal a “Sell” once the -7.5% point has been taken out in the “Off High” column.
- Trend Tracking Indexes (TTIs)
Our Trend Tracking Indexes (TTIs) barely changed again as upward momentum slowed.
Here’s how we closed 8/3/2017:
Domestic TTI: +3.16% (last close +3.25%)—Buy signal effective 4/4/2016
International TTI: +8.35% (last close +8.33%)—Buy signal effective 7/19/2016
Disclosure: I am obliged to inform you that I, as well as my advisory clients, own some of the ETFs listed in the above table. Furthermore, they do not represent a specific investment recommendation for you, they merely show which ETFs from the universe I track are falling within the guidelines specified.
Contact Ulli