
- Moving the Markets
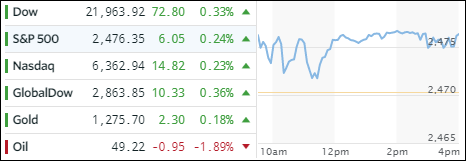
The theme of the “new normal” continued as less than glowing reports on inflation, manufacturing and collapsing ‘hard’ economic data, were brushed aside with the major indexes continuing their march into record territory. The Dow has now climbed to within striking distance of the 22,000 milestone marker.
Crude oil slipped -1.89% joined by the Transportation index (IYT) with -0.85% continuing its southerly path after having peaked the beginning of July. Semiconductors (SMH) added +0.43% while International Equities (SCHF) outperformed with a gain of +0.49%, matched by the Aerospace and Defense ETF (ITA). Those 2 were closely followed by Emerging Markets (SCHE) sporting +0.38%.
Interest rates fell, after dismal car sales, with the yield of the 10-year bond dropping 4 basis points to 2.26%, allowing the 20-year bond to rally +0.48% after having been stuck in a sideways pattern for the past week. Despite the US Dollar (UUP) rebounding, Gold pushed higher (above $1,280) and has now reached a level last seen when the Fed hiked rates. In other words, Gold’s losses caused in part by a rise in interest rates have been made up.
- ETFs in the Spotlight (updated for 2017)
In case you missed the announcement and description of this section, you can read it here again.
It features 10 broadly diversified and sector ETFs from my HighVolume list as posted every Saturday. Furthermore, they are screened for the lowest MaxDD% number meaning they have been showing better resistance to temporary sell offs than all others over the past year.
The below table simply demonstrates the magnitude with which some of the ETFs are fluctuating in regards to their positions above or below their respective individual trend lines (%M/A). A break below, represented by a negative number, shows weakness, while a break above, represented by a positive percentage, shows strength.
For hundreds of ETF choices, be sure to reference Thursday’s StatSheet.
Year to date, here’s how the 2017 candidates have fared so far:
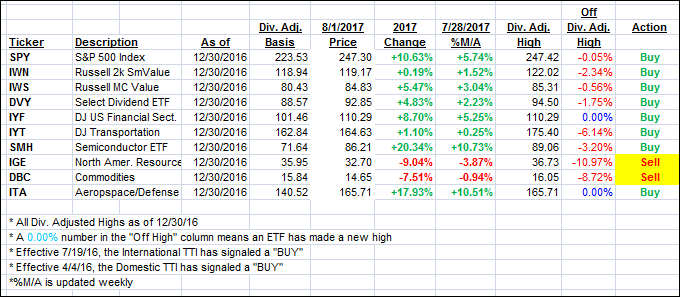
Again, the %M/A column above shows the position of the various ETFs in relation to their respective long term trend lines, while the trailing sell stops are being tracked in the “Off High” column. The “Action” column will signal a “Sell” once the -7.5% point has been taken out in the “Off High” column.
- Trend Tracking Indexes (TTIs)
Our Trend Tracking Indexes (TTIs) picked up speed and headed north as the Dow honed in on the 22,000 level.
Here’s how we closed 8/1/2017:
Domestic TTI: +3.28% (last close +3.18%)—Buy signal effective 4/4/2016
International TTI: +8.40% (last close +8.07%)—Buy signal effective 7/19/2016
Disclosure: I am obliged to inform you that I, as well as my advisory clients, own some of the ETFs listed in the above table. Furthermore, they do not represent a specific investment recommendation for you, they merely show which ETFs from the universe I track are falling within the guidelines specified.
Contact Ulli