
- Moving the Markets
The widely anticipated FOMC minutes turned out as expected with the Fed confirming that they plan on continuing their path of higher interest rates this year and also start to sell off its massive holdings of Treasuries and mortgage bonds. The thing they did not say is the timing and magnitude of their pans, which may be subject to further tinkering, which in turn left the markets in a bit of uncertainty.
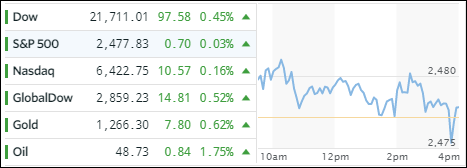
While we came off the highs by the end of the session, the major indexes managed to hang on to some gains to close in the green with the Dow getting a huge assist from Boeing’s 9.2% spike. Helping to close above the unchanged line was a crash of the VIX to a new all-time record low of 8.84, a direction that appears more insane by the day as it implies no anticipation of risk in stocks.
At the same time, warnings about the dangerous levels of the stock market accelerated today, along with concerns about the global economy, and they did not come only from high profile individuals but also from generally bullish outfits like Investors Intelligence, as you can read, here, here and here.
Interest rates dropped with the 10-year bond yield losing 4 basis points to end at 2.29%. The dollar (UUP) was spanked again, traded in a wide range and ended the day down by -0.57% a level last seen in July 2016. Gold was the beneficiary and spiked back above $1,260, a gain of +0.62%.
- ETFs in the Spotlight (updated for 2017)
In case you missed the announcement and description of this section, you can read it here again.
It features 10 broadly diversified and sector ETFs from my HighVolume list as posted every Saturday. Furthermore, they are screened for the lowest MaxDD% number meaning they have been showing better resistance to temporary sell offs than all others over the past year.
The below table simply demonstrates the magnitude with which some of the ETFs are fluctuating in regards to their positions above or below their respective individual trend lines (%M/A). A break below, represented by a negative number, shows weakness, while a break above, represented by a positive percentage, shows strength.
For hundreds of ETF choices, be sure to reference Thursday’s StatSheet.
Year to date, here’s how the 2017 candidates have fared so far:
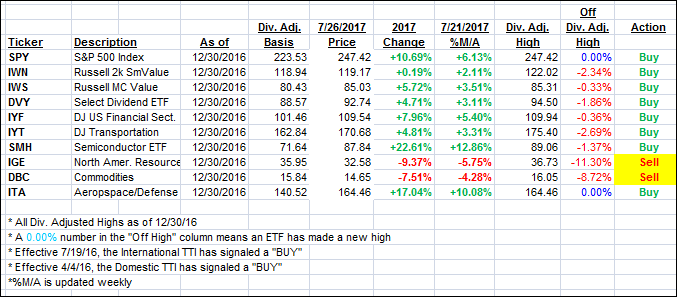
Again, the %M/A column above shows the position of the various ETFs in relation to their respective long term trend lines, while the trailing sell stops are being tracked in the “Off High” column. The “Action” column will signal a “Sell” once the -7.5% point has been taken out in the “Off High” column.
- Trend Tracking Indexes (TTIs)
Our Trend Tracking Indexes (TTIs) continue showing a mixed picture with the Domestic one barely moving and the International one jumping.
Here’s how we closed 7/26/2017:
Domestic TTI: +3.73% (last close +3.72%)—Buy signal effective 4/4/2016
International TTI: +8.90% (last close +8.50%)—Buy signal effective 7/19/2016
Disclosure: I am obliged to inform you that I, as well as my advisory clients, own some of the ETFs listed in the above table. Furthermore, they do not represent a specific investment recommendation for you, they merely show which ETFs from the universe I track are falling within the guidelines specified.
Contact Ulli