
- Moving the Markets
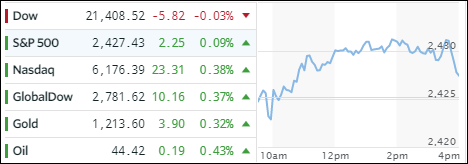
The Nasdaq managed to hold on to most of its early gains, while the Dow dropped back in the red. The S&P essentially closed unchanged, as a last hour sell off contributed to turn this session into a mixed bag.
Semiconductors, which we hold via SMH, fared very well by adding +1.03% while the Dow Transports notched a fresh new all-time intra-day high. The main focus right now is on the upcoming earnings season, which is considered the next catalyst to drive the markets—either up or down. Previous focal points, such as the health-care and the tax bill have been relegated to items simmering on the back burner.
Across the markets, retailers got spanked again with XRT losing -2.24% as the retail apocalypse can’t seem to find any mercy from the short selling crowd. Crude oil did a 360 by selling off sharply but regaining its early losses on no news at all to end up slightly in the green. Interest rates meandered with the 10-year yield dropping 1 basis point to 2.38% while the US dollar stayed in a narrow range but eked out +0.04%.
- ETFs in the Spotlight (updated for 2017)
In case you missed the announcement and description of this section, you can read it here again.
It features 10 broadly diversified and sector ETFs from my HighVolume list as posted every Saturday. Furthermore, they are screened for the lowest MaxDD% number meaning they have been showing better resistance to temporary sell offs than all others over the past year.
The below table simply demonstrates the magnitude with which some of the ETFs are fluctuating in regards to their positions above or below their respective individual trend lines (%M/A). A break below, represented by a negative number, shows weakness, while a break above, represented by a positive percentage, shows strength.
For hundreds of ETF choices, be sure to reference Thursday’s StatSheet.
Year to date, here’s how the 2017 candidates have fared so far:
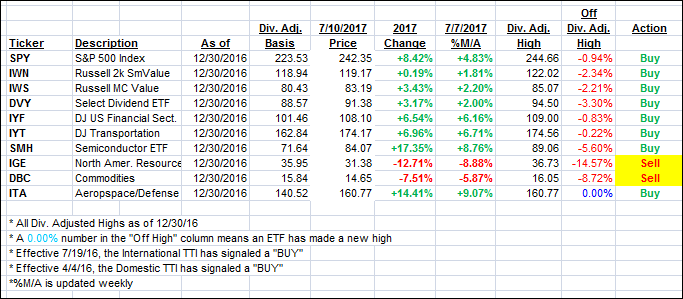
Again, the %M/A column above shows the position of the various ETFs in relation to their respective long term trend lines, while the trailing sell stops are being tracked in the “Off High” column. The “Action” column will signal a “Sell” once the -7.5% point has been taken out in the “Off High” column.
- Trend Tracking Indexes (TTIs)
Our Trend Tracking Indexes (TTIs) gained a tad as the major indexes were mixed.
Here’s how we closed 7/10/2017:
Domestic TTI: +2.94% (last close +2.88%)—Buy signal effective 4/4/2016
International TTI: +7.02% (last close +6.82%)—Buy signal effective 7/19/2016
Disclosure: I am obliged to inform you that I, as well as my advisory clients, own some of the ETFs listed in the above table. Furthermore, they do not represent a specific investment recommendation for you, they merely show which ETFs from the universe I track are falling within the guidelines specified.
Contact Ulli