
- Moving the Markets
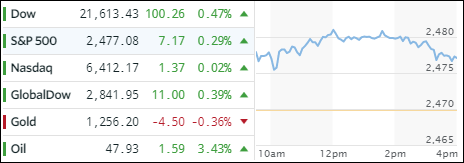
Today, it was the Dow’s turn to lead the way with the Nasdaq lagging behind, but it still managed to hang on to the plus side despite a last hour sell off. The S&P 500 and the Nasdaq closed at record highs as the VIX was slaughtered again to 9.04 intraday and has now not closed above 10 for 9 straight days. This is its longest closing period below 10 in history; in other words, as I posted yesterday, Wall Street traders are displaying total complacency and are assuming there is no risk in the markets.
Google’s 2.93% loss did not help the Nasdaq and pulled the FANG stocks down for their first loss in 13 days. Crude oil helped the overall bullish tone as the black gold rallied +3.43%.
With the Fed’s FOMC statement looming tomorrow, nervousness prevailed, and interest rates shot up 7 basis points with the 10-year bond yield settling at 2.33%.
Here’s something to think about. As ZH reports, since the lows reached immediately after the Brexit vote in 2016, the S&P 500 has seen over 270 consecutive trading sessions without a 5% peak-to-trough drawdown. This is the 4th longest stretch since 1928…
Talk about manipulation at its best.
- ETFs in the Spotlight (updated for 2017)
In case you missed the announcement and description of this section, you can read it here again.
It features 10 broadly diversified and sector ETFs from my HighVolume list as posted every Saturday. Furthermore, they are screened for the lowest MaxDD% number meaning they have been showing better resistance to temporary sell offs than all others over the past year.
The below table simply demonstrates the magnitude with which some of the ETFs are fluctuating in regards to their positions above or below their respective individual trend lines (%M/A). A break below, represented by a negative number, shows weakness, while a break above, represented by a positive percentage, shows strength.
For hundreds of ETF choices, be sure to reference Thursday’s StatSheet.
Year to date, here’s how the 2017 candidates have fared so far:
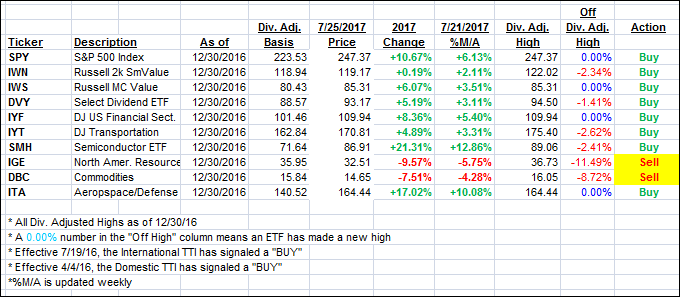
Again, the %M/A column above shows the position of the various ETFs in relation to their respective long term trend lines, while the trailing sell stops are being tracked in the “Off High” column. The “Action” column will signal a “Sell” once the -7.5% point has been taken out in the “Off High” column.
- Trend Tracking Indexes (TTIs)
Our Trend Tracking Indexes (TTIs) showed again a mixed picture with the Domestic one remaining unchanged and the International one gaining.
Here’s how we closed 7/25/2017:
Domestic TTI: +3.72% (last close +3.72%)—Buy signal effective 4/4/2016
International TTI: +8.50% (last close +8.21%)—Buy signal effective 7/19/2016
Disclosure: I am obliged to inform you that I, as well as my advisory clients, own some of the ETFs listed in the above table. Furthermore, they do not represent a specific investment recommendation for you, they merely show which ETFs from the universe I track are falling within the guidelines specified.
Contact Ulli