
- Moving the Markets
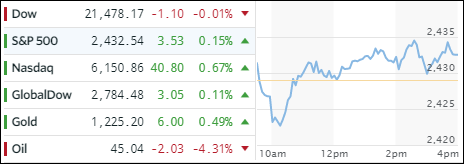
It was a tale of two markets as the Nasdaq was propelled higher with semiconductors (SMH) reversing their recent downtrend by charging ahead +1.90%. The Dow closed about unchanged, while the S&P 500 managed to eke out a small gain of +0.15%.
Things looked ugly in the energy sector as oil got hit hard and lost -4.31% following Russia’s announcement that it no longer would support output cuts. In fact, the entire energy sector got slammed with the widely followed XLE dropping -1.95%, its worst loss in 4 months.
Interest rates pulled back with the 10-year Bond now yielding 2.24% down -0.85% or 2 basis points from Tuesday. The US dollar managed a slight rebound for a 3-session gain off the 9-month lows made in late July.
- ETFs in the Spotlight (updated for 2017)
In case you missed the announcement and description of this section, you can read it here again.
It features 10 broadly diversified and sector ETFs from my HighVolume list as posted every Saturday. Furthermore, they are screened for the lowest MaxDD% number meaning they have been showing better resistance to temporary sell offs than all others over the past year.
The below table simply demonstrates the magnitude with which some of the ETFs are fluctuating in regards to their positions above or below their respective individual trend lines (%M/A). A break below, represented by a negative number, shows weakness, while a break above, represented by a positive percentage, shows strength.
For hundreds of ETF choices, be sure to reference Thursday’s StatSheet.
Year to date, here’s how the 2017 candidates have fared so far:
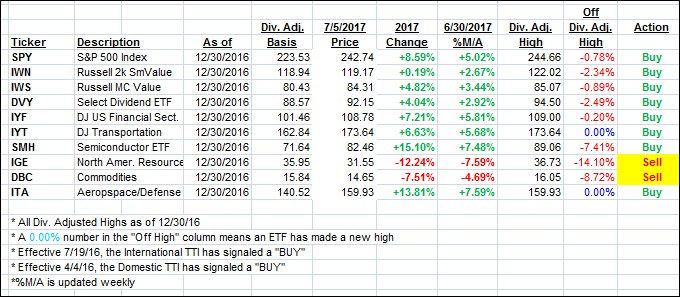
Again, the %M/A column above shows the position of the various ETFs in relation to their respective long term trend lines, while the trailing sell stops are being tracked in the “Off High” column. The “Action” column will signal a “Sell” once the -7.5% point has been taken out in the “Off High” column.
- Trend Tracking Indexes (TTIs)
Our Trend Tracking Indexes (TTIs) climbed by a fraction as the Nasdaq outperformed and saved the day.
Here’s how we closed 7/5/2017:
Domestic TTI: +3.09% (last close +2.98%)—Buy signal effective 4/4/2016
International TTI: +7.28% (last close +7.19%)—Buy signal effective 7/19/2016
Disclosure: I am obliged to inform you that I, as well as my advisory clients, own some of the ETFs listed in the above table. Furthermore, they do not represent a specific investment recommendation for you, they merely show which ETFs from the universe I track are falling within the guidelines specified.
Contact Ulli