
- Moving the Markets
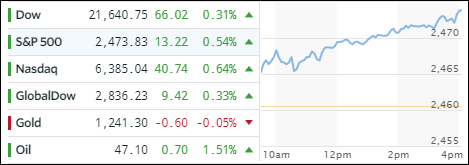
Despite IBM being a drag on the Dow (about -47 points), and the Transportation index (IYT) stumbling for the third day in a row, its biggest drop in 2 months, all three major indexes were able to march into record territory on low volume and no earthshaking news.
Helping the bullish cause were better-than-expected earnings from Morgan Stanley, which helped to create some optimism in the face of a slowing economy and, at least for the day, lent support to the current lofty index levels.
Across asset classes, SmallCaps took top billing with SCHA gaining a solid +1.02%, which was closely followed by Semiconductors (SMH) and MidCaps (SCHM) adding +0.99% and +0.94% respectively. Financials struggled but ended up in the green and Retail continued its recent bounce. Interest rates remained unchanged, while the US dollar (UUP) did its best dead-cat-bounce imitation by gaining +0.24%.
- ETFs in the Spotlight (updated for 2017)
In case you missed the announcement and description of this section, you can read it here again.
It features 10 broadly diversified and sector ETFs from my HighVolume list as posted every Saturday. Furthermore, they are screened for the lowest MaxDD% number meaning they have been showing better resistance to temporary sell offs than all others over the past year.
The below table simply demonstrates the magnitude with which some of the ETFs are fluctuating in regards to their positions above or below their respective individual trend lines (%M/A). A break below, represented by a negative number, shows weakness, while a break above, represented by a positive percentage, shows strength.
For hundreds of ETF choices, be sure to reference Thursday’s StatSheet.
Year to date, here’s how the 2017 candidates have fared so far:
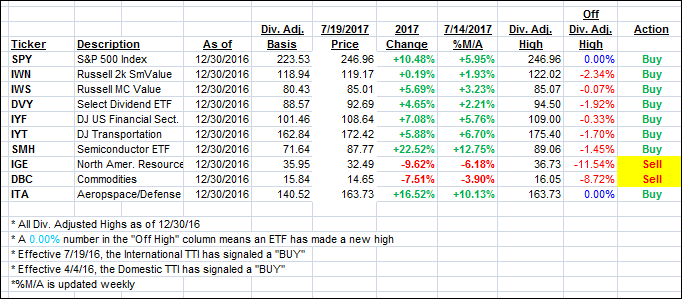
Again, the %M/A column above shows the position of the various ETFs in relation to their respective long term trend lines, while the trailing sell stops are being tracked in the “Off High” column. The “Action” column will signal a “Sell” once the -7.5% point has been taken out in the “Off High” column.
- Trend Tracking Indexes (TTIs)
Our Trend Tracking Indexes (TTIs) took a jump as the major indexes carved out new all-time highs.
Here’s how we closed 7/19/2017:
Domestic TTI: +3.84% (last close +3.54%)—Buy signal effective 4/4/2016
International TTI: +8.67% (last close +8.39%)—Buy signal effective 7/19/2016
Disclosure: I am obliged to inform you that I, as well as my advisory clients, own some of the ETFs listed in the above table. Furthermore, they do not represent a specific investment recommendation for you, they merely show which ETFs from the universe I track are falling within the guidelines specified.
Contact Ulli