
- Moving the Markets
This one came out of left field. Fed chair Yellen’s testimony before congress was interpreted as “dovish” an odd statement given the recent jawboning about “asset prices looking rich.” After weeks of talking about higher rates and reducing its balance sheet, did the Fed just flip flop and acknowledge once again its ignorance? Be that is it may, all traders needed to hear were those always hoped for words that “rates may not rise much from here” and off to the races we went.
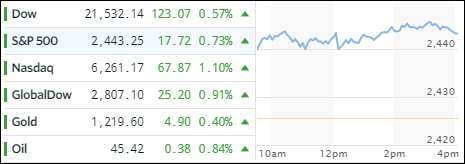
The major indexes scored some nice gains across the board with the Nasdaq being the lead dog again. Semiconductors did well with SMH gaining +1.44%, but Emerging Markets topped the list with SCHE adding +1.95%. Transportation (IYT) had a good day by scoring +1.20%.
Bonds rallied with the 20-year T-bond gapping up and gaining +0.69%, which was the best day in about a month. Gold and oil joined the party, but the whipping boy of the day was the US dollar which, in light of the Yellen’s dovish statement, headed south again.
It remains to be seen if this market reaction was simply irrational or the basis for further advances. The upcoming earnings season will certainly play a big role in this outcome.
- ETFs in the Spotlight (updated for 2017)
In case you missed the announcement and description of this section, you can read it here again.
It features 10 broadly diversified and sector ETFs from my HighVolume list as posted every Saturday. Furthermore, they are screened for the lowest MaxDD% number meaning they have been showing better resistance to temporary sell offs than all others over the past year.
The below table simply demonstrates the magnitude with which some of the ETFs are fluctuating in regards to their positions above or below their respective individual trend lines (%M/A). A break below, represented by a negative number, shows weakness, while a break above, represented by a positive percentage, shows strength.
For hundreds of ETF choices, be sure to reference Thursday’s StatSheet.
Year to date, here’s how the 2017 candidates have fared so far:
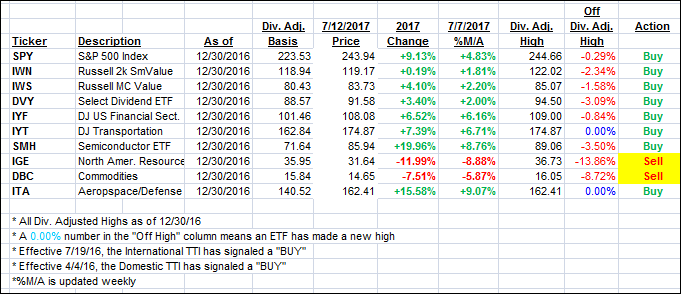
Again, the %M/A column above shows the position of the various ETFs in relation to their respective long term trend lines, while the trailing sell stops are being tracked in the “Off High” column. The “Action” column will signal a “Sell” once the -7.5% point has been taken out in the “Off High” column.
- Trend Tracking Indexes (TTIs)
Our Trend Tracking Indexes (TTIs) jumped as green was the color of the day across the board.
Here’s how we closed 7/12/2017:
Domestic TTI: +3.40% (last close +2.99%)—Buy signal effective 4/4/2016
International TTI: +8.08% (last close +7.10%)—Buy signal effective 7/19/2016
Disclosure: I am obliged to inform you that I, as well as my advisory clients, own some of the ETFs listed in the above table. Furthermore, they do not represent a specific investment recommendation for you, they merely show which ETFs from the universe I track are falling within the guidelines specified.
Contact Ulli