
ETF Tracker StatSheet
https://theetfbully.com/2017/07/weekly-statsheet-etf-tracker-newsletter-updated-07062017/
ROLLER-COASTER WEEK ENDS ON A POSITIVE NOTE
- Moving the Markets
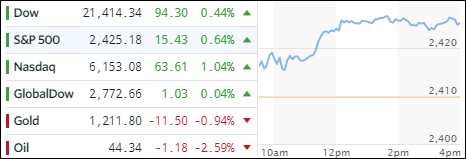
A roller-coaster week ended on the plus side with the S&P 500 squeezing out a 2 point gain after recovering from yesterday’s sell off. A better than expected jobs number supported equities with the employment report showing that 222,000 jobs (vs. 179k expected) were added in June. The unemployment rate ticked up to 4.4% from 4.3%.
While the number made a good headline and sparked bullish optimism, the devil was in the details. While it helped that April and May payrolls were revised upward, and added +47,000 more than reported it also may validate the Fed’s hawkish bias, meaning more rate hikes may be forthcoming in the future, an outcome which will affect equities negatively at some point.
Also, wage growth disappointed with a hike in average hourly earnings of only +0.2%, while the number was revised lower for May from +0.2% to +0.1%. So, where were most of the jobs generated? Health care took the lead with +37,000, which was closely followed by business and professional services (+35,000). The third place was occupied by low end food services and drinking places (+29,000) confirming that the waitress and bartender jobs are continuing their trend higher having generated 277,000 positions over the year.
Interest rates continued their upward trajectory with the 10-year bond yield rising by 2 basis points to 2.39%, its highest spot since early May. The Dollar index, as represented by UUP, managed to bounce +0.16% after having dropped 2 straight days. Oil slipped -2.59% while gold had a bad week and dropped to March lows.
- ETFs in the Spotlight (updated for 2017)
In case you missed the announcement and description of this section, you can read it here again.
It features 10 broadly diversified and sector ETFs from my HighVolume list as posted every Saturday. Furthermore, they are screened for the lowest MaxDD% number meaning they have been showing better resistance to temporary sell offs than all others over the past year.
The below table simply demonstrates the magnitude with which some of the ETFs are fluctuating in regards to their positions above or below their respective individual trend lines (%M/A). A break below, represented by a negative number, shows weakness, while a break above, represented by a positive percentage, shows strength.
For hundreds of ETF choices, be sure to reference Thursday’s StatSheet.
Year to date, here’s how the 2017 candidates have fared so far:
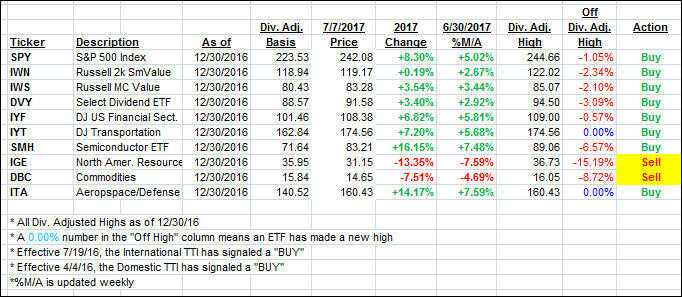
Again, the %M/A column above shows the position of the various ETFs in relation to their respective long term trend lines, while the trailing sell stops are being tracked in the “Off High” column. The “Action” column will signal a “Sell” once the -7.5% point has been taken out in the “Off High” column.
- Trend Tracking Indexes (TTIs)
Our Trend Tracking Indexes (TTIs) recovered from yesterday’s drubbing but closed mixed.
Here’s how we closed 7/7/2017:
Domestic TTI: +2.88% (last close +2.70%)—Buy signal effective 4/4/2016
International TTI: +6.82% (last close +6.92%)—Buy signal effective 7/19/2016
————————————————————-
READER Q & A FOR THE WEEK
All Reader Q & A’s are listed at our web site!
Check it out at:
https://theetfbully.com/questions-answers/
———————————————————-
WOULD YOU LIKE TO HAVE YOUR INVESTMENTS PROFESSIONALLY MANAGED?
Do you have the time to follow our investment plans yourself? If you are a busy professional who would like to have his portfolio managed using our methodology, please contact me directly or get more details at:
https://theetfbully.com/personal-investment-management/
———————————————————
Back issues of the ETF/No Load Fund Tracker are available on the web at:
https://theetfbully.com/newsletter-archives/
Contact Ulli