
- Moving the Markets
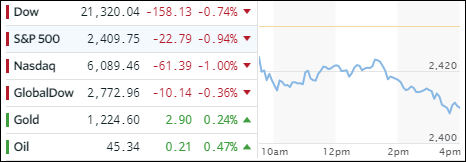
The debacle started in Europe, as ugly bond auctions in France and Spain set a negative tone for the day, which quickly spread across the Atlantic pushing US interest rates higher (and bond prices lower) while pulling equities off their lofty levels with the Nasdaq surrendering -1%.
Not helping was the German Bond (Bund) yield ripping higher to 0.562%, which is low by US standards, but is the highest since January 2016, causing most European equities to hit the skids as well. Adding to the uncertainty and nervousness in general were news reports from the G-20 meeting in Hamburg including protesters fighting with police.
Risk parity funds, which switch their investments from stocks to bonds and vice versa, depending on which asset class displays more bullish tendencies, got caught in the trap, I have written about before, namely, that “what happens if stocks and bonds drop at the same time?”, a scenario we are witnessing right now causing these entities to go into “unwind” mode.
The 10-year bond yield shot up 4 basis points to 2.37%, its highest reading since the beginning of May. The US dollar went the other way with the widely followed UUP giving back some of its recent gains by ending down -0.44%. Gold closed slightly higher but is still struggling to reclaim its 200-day M/A.
- ETFs in the Spotlight (updated for 2017)
In case you missed the announcement and description of this section, you can read it here again.
It features 10 broadly diversified and sector ETFs from my HighVolume list as posted every Saturday. Furthermore, they are screened for the lowest MaxDD% number meaning they have been showing better resistance to temporary sell offs than all others over the past year.
The below table simply demonstrates the magnitude with which some of the ETFs are fluctuating in regards to their positions above or below their respective individual trend lines (%M/A). A break below, represented by a negative number, shows weakness, while a break above, represented by a positive percentage, shows strength.
For hundreds of ETF choices, be sure to reference Thursday’s StatSheet.
Year to date, here’s how the 2017 candidates have fared so far:
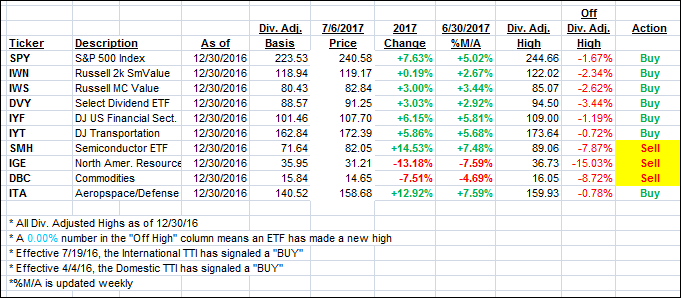
Again, the %M/A column above shows the position of the various ETFs in relation to their respective long term trend lines, while the trailing sell stops are being tracked in the “Off High” column. The “Action” column will signal a “Sell” once the -7.5% point has been taken out in the “Off High” column.
- Trend Tracking Indexes (TTIs)
Our Trend Tracking Indexes (TTIs) headed south as higher interest rates took a toll on stock prices around the world.
Here’s how we closed 7/6/2017:
Domestic TTI: +2.70% (last close +3.09%)—Buy signal effective 4/4/2016
International TTI: +6.92% (last close +7.28%)—Buy signal effective 7/19/2016
Disclosure: I am obliged to inform you that I, as well as my advisory clients, own some of the ETFs listed in the above table. Furthermore, they do not represent a specific investment recommendation for you, they merely show which ETFs from the universe I track are falling within the guidelines specified.
Contact Ulli