
- Moving the Markets
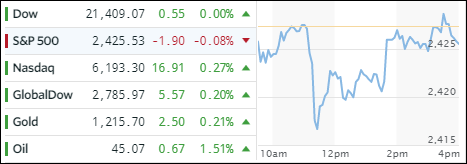
An early climb back to the unchanged line unraveled all of a sudden as the markets reversed and plunged on news about Trump Jr. releasing a chain of emails alleged to have played a role of Russian involvement in the Trump Sr. election. The soap opera continued for a while but, after the knee-jerk reaction, the major indexes spent the rest of the day trying to conquer the unchanged line.
The mission was accomplished with the exception of the S&P 500, which fell short by a tad. Throwing an assist was news by the Senate that they would delay their summer recess until the third week of August in order to work on crucial matters such as the health-care bill and tax cuts; if you can believe that.
The Nasdaq was the winner again and SmallCaps managed to squeeze out a solid gain of +0.24%. Yields on T-bonds were mixed with 20-year bouncing off the lows and closing above the unchanged line by +0.17%. The US dollar (UUP) was not so lucky and lost -0.36% and is now honing in on its October 2016 lows.
- ETFs in the Spotlight (updated for 2017)
In case you missed the announcement and description of this section, you can read it here again.
It features 10 broadly diversified and sector ETFs from my HighVolume list as posted every Saturday. Furthermore, they are screened for the lowest MaxDD% number meaning they have been showing better resistance to temporary sell offs than all others over the past year.
The below table simply demonstrates the magnitude with which some of the ETFs are fluctuating in regards to their positions above or below their respective individual trend lines (%M/A). A break below, represented by a negative number, shows weakness, while a break above, represented by a positive percentage, shows strength.
For hundreds of ETF choices, be sure to reference Thursday’s StatSheet.
Year to date, here’s how the 2017 candidates have fared so far:
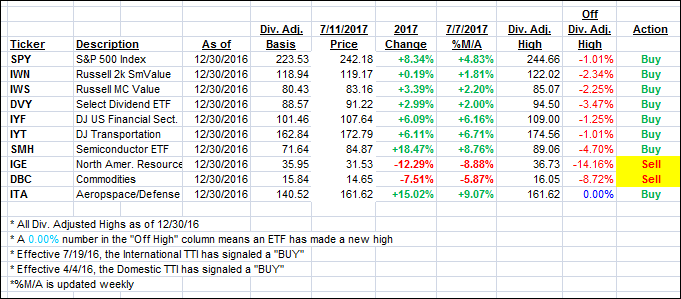
Again, the %M/A column above shows the position of the various ETFs in relation to their respective long term trend lines, while the trailing sell stops are being tracked in the “Off High” column. The “Action” column will signal a “Sell” once the -7.5% point has been taken out in the “Off High” column.
- Trend Tracking Indexes (TTIs)
Our Trend Tracking Indexes (TTIs) again gained a tad as the major indexes went on a roller-coaster ride.
Here’s how we closed 7/11/2017:
Domestic TTI: +2.99% (last close +2.94%)—Buy signal effective 4/4/2016
International TTI: +7.10% (last close +7.02%)—Buy signal effective 7/19/2016
Disclosure: I am obliged to inform you that I, as well as my advisory clients, own some of the ETFs listed in the above table. Furthermore, they do not represent a specific investment recommendation for you, they merely show which ETFs from the universe I track are falling within the guidelines specified.
Contact Ulli