
- Moving the Markets
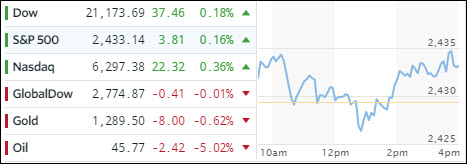
MSM was keeping the hype up ahead of this Thursday by using phrases like “market moving” in regards to Comey’s testimony and the UK election. I think the cat is out of the bag, as Comey’s prepared remarks confirmed there is no smoking gun, which the major indexes took as a positive by rallying modestly for most of the afternoon and closing above the unchanged line.
The surprise of the day happened in the crude oil arena when data showed that there was a “shocking” inventory built in crude and products, which sent oil into a tailspin with a loss of -5.02%, its biggest drop in 3 months. Widely held Energy ETFs like IGE dropped -1.89%.
Bond yields got a small lift today with the 10-year yield rising 4 basis points to end the day at 2.18%, which in turn helped the financial ETF XLF gain +0.77%. The US dollar interrupted its vicious downtrend of the past 5 months and bounced off yesterday’s lows by +0.12%.
- ETFs in the Spotlight (updated for 2017)
In case you missed the announcement and description of this section, you can read it here again.
It features 10 broadly diversified and sector ETFs from my HighVolume list as posted every Saturday. Furthermore, they are screened for the lowest MaxDD% number meaning they have been showing better resistance to temporary sell offs than all others over the past year.
The below table simply demonstrates the magnitude with which some of the ETFs are fluctuating in regards to their positions above or below their respective individual trend lines (%M/A). A break below, represented by a negative number, shows weakness, while a break above, represented by a positive percentage, shows strength.
For hundreds of ETF choices, be sure to reference Thursday’s StatSheet.
Year to date, here’s how the 2017 candidates have fared so far:
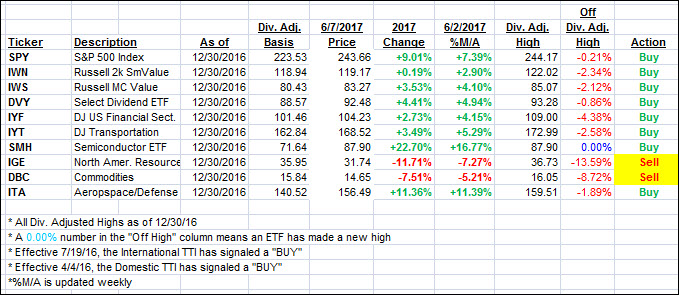
Again, the %M/A column above shows the position of the various ETFs in relation to their respective long term trend lines, while the trailing sell stops are being tracked in the “Off High” column. The “Action” column will signal a “Sell” once the -7.5% point has been taken out in the “Off High” column.
- Trend Tracking Indexes (TTIs)
Our Trend Tracking Indexes (TTIs) moved insignificantly, as the markets continued to be in holding mode in anticipation of tomorrow’s events.
Here’s how we closed 6/7/2017:
Domestic TTI: +4.08% (last close +4.02%)—Buy signal effective 4/4/2016
International TTI: +8.39% (last close +8.42%)—Buy signal effective 7/19/2016
Disclosure: I am obliged to inform you that I, as well as my advisory clients, own some of the ETFs listed in the above table. Furthermore, they do not represent a specific investment recommendation for you, they merely show which ETFs from the universe I track are falling within the guidelines specified.
Contact Ulli