
- Moving the Markets
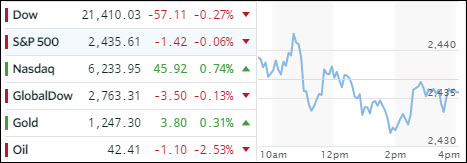
Crude oil along with the energy sector continued its slippery slide with XLE giving back -1.61%, while Crude Oil (WTI) crashed -2.53% to a $42 handle, which is its lowest since last August. Biotechs were the beneficiary of this carnage gaining some 8% over the past 3 days.
It’s a strange market, as even the big banks released the following quotes (Hat tip to ZH):
- BofA: “markets are very weird”
- JPM: “low vols will suffer catastrophic losses”
- DB: “cataclysmic events are coming”
- GS: “it will end in tears”
- Citi:”expect markets to flounder as central banks try to exit”
I mentioned yesterday that crude oil’s slippery path can be a harbinger of things to come and surely the energy arena has been the first victim. High yield credit (HYG) is starting to weaken as well because of its ties to energy financing. Retail followed the path of least resistance “down” and XRT lost -1.32%.
Bucking the trend was the Nasdaq, which surprisingly went straight up, never looked back and turned out to be the winner for the day. Treasury bonds were mixed with the 10-year yield remaining unchanged at 2.22%. The US dollar slipped -0.20% helping gold to close up and approaching its 200-day M/A from the downside.
- ETFs in the Spotlight (updated for 2017)
In case you missed the announcement and description of this section, you can read it here again.
It features 10 broadly diversified and sector ETFs from my HighVolume list as posted every Saturday. Furthermore, they are screened for the lowest MaxDD% number meaning they have been showing better resistance to temporary sell offs than all others over the past year.
The below table simply demonstrates the magnitude with which some of the ETFs are fluctuating in regards to their positions above or below their respective individual trend lines (%M/A). A break below, represented by a negative number, shows weakness, while a break above, represented by a positive percentage, shows strength.
For hundreds of ETF choices, be sure to reference Thursday’s StatSheet.
Year to date, here’s how the 2017 candidates have fared so far:
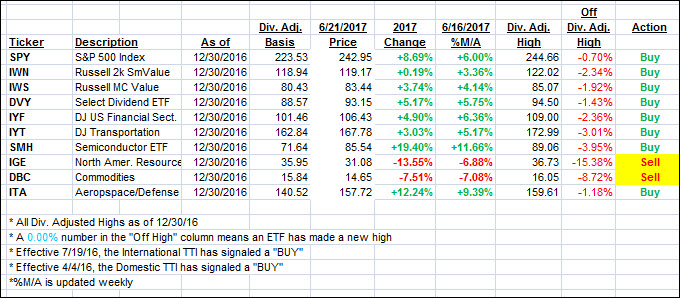
Again, the %M/A column above shows the position of the various ETFs in relation to their respective long term trend lines, while the trailing sell stops are being tracked in the “Off High” column. The “Action” column will signal a “Sell” once the -7.5% point has been taken out in the “Off High” column.
- Trend Tracking Indexes (TTIs)
Our Trend Tracking Indexes (TTIs) changed immaterially as the sideways pattern continued.
Here’s how we closed 6/21/2017:
Domestic TTI: +3.55% (last close +3.51%)—Buy signal effective 4/4/2016
International TTI: +7.44% (last close +7.30%)—Buy signal effective 7/19/2016
Disclosure: I am obliged to inform you that I, as well as my advisory clients, own some of the ETFs listed in the above table. Furthermore, they do not represent a specific investment recommendation for you, they merely show which ETFs from the universe I track are falling within the guidelines specified.
Contact Ulli