
- Moving the Markets
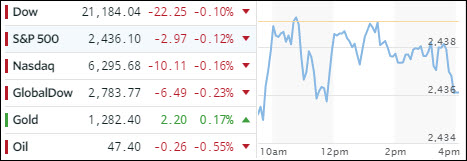
Geopolitical uncertainties, such as the London terrorist attack and the upcoming testimony of former FMI chief Comey, combined to pull the starch out of last week’s upward momentum. Not helping matters was the continuing weakness in the US Macro data index, which has slipped now to its lowest level since February 2016 when the markets were collapsing amid global recession fears.
To be clear, the pullback was tiny when looking at the bigger scheme of things and hardly worth mentioning. The major indexes traded in a tight range showing weakness into the close with especially SmallCaps being the laggard of the session.
Despite an early really, bank stocks reversed giving up most of their gains as interest rates dropped with the 10-year yield slipping 6 basis points not only end the day at 2.15%, its lowest since November 2016, but also breaking its 200-day M/A to the downside. The Dollar index (UUP) edged up a tad but remains at lows last seen in October 2016.
- ETFs in the Spotlight (updated for 2017)
In case you missed the announcement and description of this section, you can read it here again.
It features 10 broadly diversified and sector ETFs from my HighVolume list as posted every Saturday. Furthermore, they are screened for the lowest MaxDD% number meaning they have been showing better resistance to temporary sell offs than all others over the past year.
The below table simply demonstrates the magnitude with which some of the ETFs are fluctuating in regards to their positions above or below their respective individual trend lines (%M/A). A break below, represented by a negative number, shows weakness, while a break above, represented by a positive percentage, shows strength.
For hundreds of ETF choices, be sure to reference Thursday’s StatSheet.
Year to date, here’s how the 2017 candidates have fared so far:
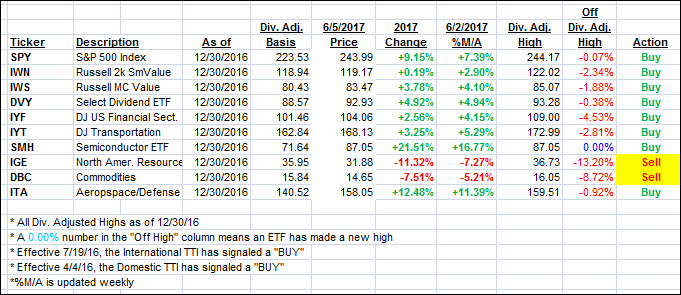
Again, the %M/A column above shows the position of the various ETFs in relation to their respective long term trend lines, while the trailing sell stops are being tracked in the “Off High” column. The “Action” column will signal a “Sell” once the -7.5% point has been taken out in the “Off High” column.
- Trend Tracking Indexes (TTIs)
Our Trend Tracking Indexes (TTIs) slipped as the markets were directionless for most of the session.
Here’s how we closed 6/5/2017:
Domestic TTI: +4.09% (last close +4.19%)—Buy signal effective 4/4/2016
International TTI: +8.76% (last close +8.94%)—Buy signal effective 7/19/2016
Disclosure: I am obliged to inform you that I, as well as my advisory clients, own some of the ETFs listed in the above table. Furthermore, they do not represent a specific investment recommendation for you, they merely show which ETFs from the universe I track are falling within the guidelines specified.
Contact Ulli