
- Moving the Markets
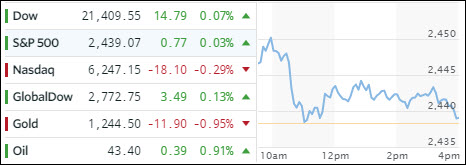
It was another roller coaster session with the major indexes ramping higher right out of the gate, only to see early gains evaporate, as Dow ended a string of daily losses at four, but only by the tiniest of margins. So did the S&P 500, but the Nasdaq stumbled and closed the day in the red. Emerging markets reigned superior with SCHE adding a solid +1.13% in an otherwise momentum-less trading session.
However, some momentum was present in the precious metals markets but, unfortunately, it was the downside. Gold flash-crashed this morning plunging $18, or 1.6%, to $1,236 on massive volume, as someone dumped $2 billion (over 18,000 contracts) in a matter of seconds. Naturally, silver was dragged down with it in what was an obvious attempt to manipulate prices. After all, if you wanted to sell at the highest price you would do it carefully and deliberately and not all at once.
Economic data points continued their nose dive with Durable Goods and the Chicago Fed’s National Activity Index both tumbling and missing expectations by a huge margin. As a result, the Citi Macro Surprise Index slumped to its lowest level since the middle of 2011.
Treasury yields fell with the 10-year bond now yielding 2.14%, which is its lowest since November 2016. The US dollar had its own roller-coaster ride, first sharply dropping on the weak economic data points and then rallying to manage a gain of +0.06%, as measured by UUP.
- ETFs in the Spotlight (updated for 2017)
In case you missed the announcement and description of this section, you can read it here again.
It features 10 broadly diversified and sector ETFs from my HighVolume list as posted every Saturday. Furthermore, they are screened for the lowest MaxDD% number meaning they have been showing better resistance to temporary sell offs than all others over the past year.
The below table simply demonstrates the magnitude with which some of the ETFs are fluctuating in regards to their positions above or below their respective individual trend lines (%M/A). A break below, represented by a negative number, shows weakness, while a break above, represented by a positive percentage, shows strength.
For hundreds of ETF choices, be sure to reference Thursday’s StatSheet.
Year to date, here’s how the 2017 candidates have fared so far:
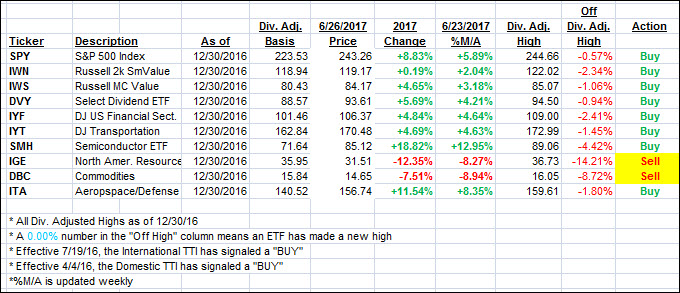
Again, the %M/A column above shows the position of the various ETFs in relation to their respective long term trend lines, while the trailing sell stops are being tracked in the “Off High” column. The “Action” column will signal a “Sell” once the -7.5% point has been taken out in the “Off High” column.
- Trend Tracking Indexes (TTIs)
Our Trend Tracking Indexes (TTIs) barely changed as the sideways pattern continued.
Here’s how we closed 6/26/2017:
Domestic TTI: +3.54% (last close +3.57%)—Buy signal effective 4/4/2016
International TTI: +7.43% (last close +7.30%)—Buy signal effective 7/19/2016
Disclosure: I am obliged to inform you that I, as well as my advisory clients, own some of the ETFs listed in the above table. Furthermore, they do not represent a specific investment recommendation for you, they merely show which ETFs from the universe I track are falling within the guidelines specified.
Contact Ulli