
- Moving the Markets
In the face of poor economic news, the Fed did the expected by hiking interest rates 0.25% and set plans in motion to shrink its $4.5 trillion balance sheet reflecting the view that “an economic expansion now entering its ninth year no longer needs so much propping up.” They also appeared to stick to their plans for one more rate increase this year.
The latest economic data released showed anything but an expansion:
- The Core PPI disappointed the inflation hoping crowd as it printed +1.7%, which was worse than the expected 1.9% and the weakest growth since February 2015.
- Headline CPI slowed from 2.2% YoY to 1.9% YOY (also missing expectations)
- S. retail sales are the weakest in 16 months as sales sank -0.3%, the biggest drop since January 2016.
- Business inventories tumbled 0.2% MoM in April, the biggest drop since Novembe3 2015.
- Inventory-to-sales stagnated but remain in a recession-signaling mode. Not a good sign for Q2 GDP.
Source: ZH and MarketWatch
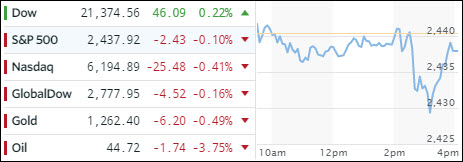
After the Fed announcement, the major indexes headed south and rebounded during the last hour with only the Dow crossing back above the unchanged line.
Gold’s early rally was wiped out and the metal ended down -0.48%. The FANG stocks were slammed again and T-bond yields collapsed with the 10-year dropping from yesterday’s close of 2.21% to 2.15%. As yields tanked, bond prices rallied with the 20-year T-Bond ETF (TLT) gaining +1.54%.
The US Dollar index had its own roller coaster ride dropping sharply early on, after the release of weak CPI and Retail Sales data, but it shifted into rally mode, after the Fed decision was released, and made up most of the losses to close down by a only a minimal -0.08% (UUP).
- ETFs in the Spotlight (updated for 2017)
In case you missed the announcement and description of this section, you can read it here again.
It features 10 broadly diversified and sector ETFs from my HighVolume list as posted every Saturday. Furthermore, they are screened for the lowest MaxDD% number meaning they have been showing better resistance to temporary sell offs than all others over the past year.
The below table simply demonstrates the magnitude with which some of the ETFs are fluctuating in regards to their positions above or below their respective individual trend lines (%M/A). A break below, represented by a negative number, shows weakness, while a break above, represented by a positive percentage, shows strength.
For hundreds of ETF choices, be sure to reference Thursday’s StatSheet.
Year to date, here’s how the 2017 candidates have fared so far:
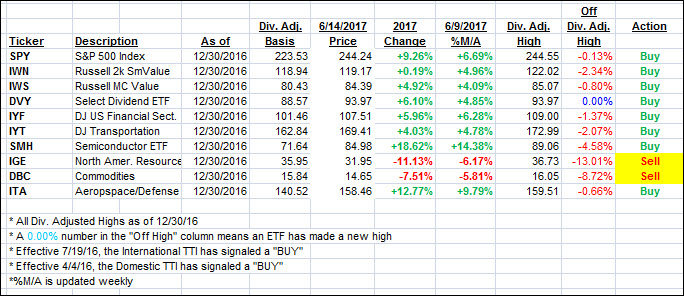
Again, the %M/A column above shows the position of the various ETFs in relation to their respective long term trend lines, while the trailing sell stops are being tracked in the “Off High” column. The “Action” column will signal a “Sell” once the -7.5% point has been taken out in the “Off High” column.
- Trend Tracking Indexes (TTIs)
Our Trend Tracking Indexes (TTIs) meandered and changed only by a fraction as the major indexes round tripped.
Here’s how we closed 6/14/2017:
Domestic TTI: +3.73% (last close +3.77%)—Buy signal effective 4/4/2016
International TTI: +7.65% (last close +7.85%)—Buy signal effective 7/19/2016
Disclosure: I am obliged to inform you that I, as well as my advisory clients, own some of the ETFs listed in the above table. Furthermore, they do not represent a specific investment recommendation for you, they merely show which ETFs from the universe I track are falling within the guidelines specified.
Contact Ulli