
- Moving the Markets
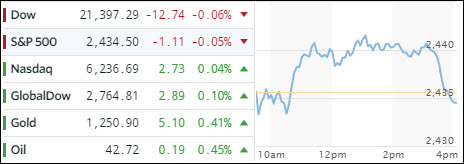
It was another session that ended in a mixed close with the major indexes giving up their hard fought mid-day gains, as they slumped into the close with only the S&P 500 showing a tiny gain of +0.04%. SmallCaps did better as both, domestic and international ones, managed to eke out +0.38% and +0.27% respectively.
Healthcare (XLV) saved the day and continued its winning ways of the past 4 days by adding another +1.04%, which was largely offset in the indexes by the Financials/Banks with the Regional Banking ETF (KRE) surrendering -0.67% while GS gave back -1.22%.
Interest rates slipped after one of the Fed’s mouthpieces (Bullard) uttered in an interview that “the Fed’s projected rate path may be too aggressive.” That helped the S&P to climb out of the red early on, but it was not enough to keep the momentum going. But, the 10-year bond yield slipped to settle at 2.15%.
Crude oil finally managed a rebound joined by the retailers with XRT closing up +0.59%, which looked more like a dead cat bounce than the beginning of a meaningful reversal. The US dollar meandered aimlessly with UUP closing up a tiny +0.04%.
- ETFs in the Spotlight (updated for 2017)
In case you missed the announcement and description of this section, you can read it here again.
It features 10 broadly diversified and sector ETFs from my HighVolume list as posted every Saturday. Furthermore, they are screened for the lowest MaxDD% number meaning they have been showing better resistance to temporary sell offs than all others over the past year.
The below table simply demonstrates the magnitude with which some of the ETFs are fluctuating in regards to their positions above or below their respective individual trend lines (%M/A). A break below, represented by a negative number, shows weakness, while a break above, represented by a positive percentage, shows strength.
For hundreds of ETF choices, be sure to reference Thursday’s StatSheet.
Year to date, here’s how the 2017 candidates have fared so far:
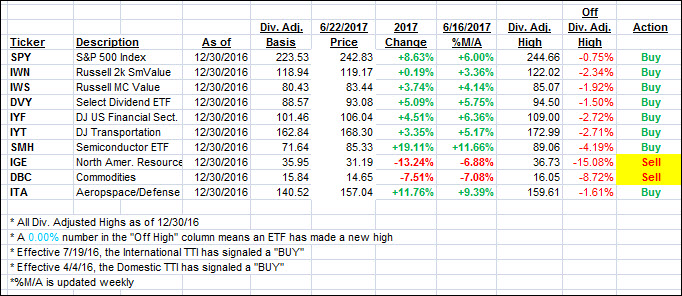
Again, the %M/A column above shows the position of the various ETFs in relation to their respective long term trend lines, while the trailing sell stops are being tracked in the “Off High” column. The “Action” column will signal a “Sell” once the -7.5% point has been taken out in the “Off High” column.
- Trend Tracking Indexes (TTIs)
Our Trend Tracking Indexes (TTIs) again changed immaterially as we continue to be stuck in a sideways pattern.
Here’s how we closed 6/22/2017:
Domestic TTI: +3.55% (last close +3.55%)—Buy signal effective 4/4/2016
International TTI: +7.54% (last close +7.44%)—Buy signal effective 7/19/2016
Disclosure: I am obliged to inform you that I, as well as my advisory clients, own some of the ETFs listed in the above table. Furthermore, they do not represent a specific investment recommendation for you, they merely show which ETFs from the universe I track are falling within the guidelines specified.
Contact Ulli