
- Moving the Markets
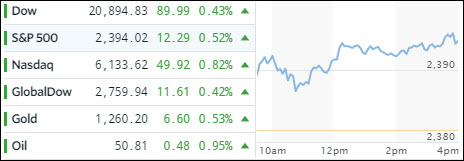
Another effort to push equities back to levels reached prior to last Wednesday’s sell-off was successful with all three major indexes gaining for the third day in a row as the S&P 500 is now lurking within 8 points of its all-time high and is back in the green for May. However, the fly in the ointment over the past few days has been low volume, which indicates lack of participation in this rally.
President Trump’s trip to Saudi Arabia proved to be beneficial for defense stocks as he signed a mammoth weapons deal, which lifted ITA +1.12% for the day. Interest rates climbed slightly with the 10-year yield reaching 2.25%. The US dollar continued its freefall with UUP losing another -0.16% reaching a level last seen in October 2016. Apparently Trump’s tough talk of “the dollar is too strong” seems to be working.
Precious metals gained on the day and following through from last week’s rally. Crude oil joined the party and recaptured the $50/barrel level but just stayed below $51. Of course, oil has been on a wild roller coaster ride this year ranging from a high of $55.03 to a low of $43.76 thanks to endless OPEC jawboning about production cutbacks, which have been making the headlines almost daily.
- ETFs in the Spotlight (updated for 2017)
In case you missed the announcement and description of this section, you can read it here again.
It features 10 broadly diversified and sector ETFs from my HighVolume list as posted every Saturday. Furthermore, they are screened for the lowest MaxDD% number meaning they have been showing better resistance to temporary sell offs than all others over the past year.
The below table simply demonstrates the magnitude with which some of the ETFs are fluctuating in regards to their positions above or below their respective individual trend lines (%M/A). A break below, represented by a negative number, shows weakness, while a break above, represented by a positive percentage, shows strength.
For hundreds of ETF choices, be sure to reference Thursday’s StatSheet.
Year to date, here’s how the 2017 candidates have fared so far:
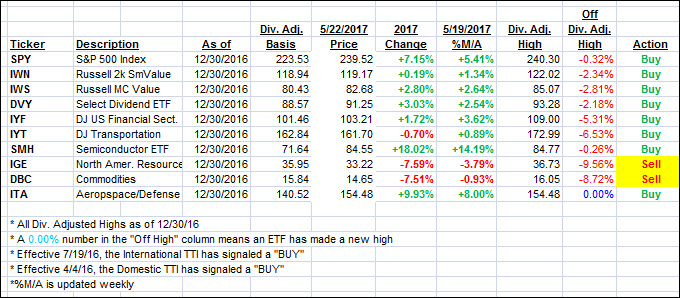
Again, the %M/A column above shows the position of the various ETFs in relation to their respective long term trend lines, while the trailing sell stops are being tracked in the “Off High” column. The “Action” column will signal a “Sell” once the -7.5% point has been taken out in the “Off High” column.
- Trend Tracking Indexes (TTIs)
Our Trend Tracking Indexes (TTIs) gained as the upward momentum of the past two trading days continued into this week.
Here’s how we closed 5/22/2017:
Domestic TTI: +3.36% (last close +3.11%)—Buy signal effective 4/4/2016
International TTI: +8.39% (last close +8.06%)—Buy signal effective 7/19/2016
Disclosure: I am obliged to inform you that I, as well as my advisory clients, own some of the ETFs listed in the above table. Furthermore, they do not represent a specific investment recommendation for you, they merely show which ETFs from the universe I track are falling within the guidelines specified.
Contact Ulli