
- Moving the Markets
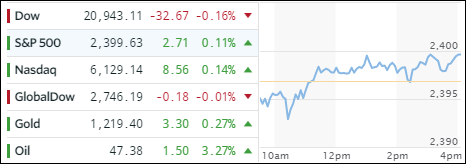
While the Nasdaq managed to ease higher by just enough of a margin to register a new record close for the 4th straight day, the Dow slipped a tad but the S&P managed to bounce against its 2,400 glass ceiling without breaking it.
The Dow suffered a bit from a stock slide in Boeing following headlines that the 737 Max flight will be temporarily suspended due to engine issues. Also not helping the Dow was a news report about Apple experiencing production delays.
Of course, the headlines du jour were all about Trump’s dismissal of FBI head Comey, which surprisingly did not appear to have any market impact following the meme of the past couple of years that “any news is good news.” The VIX remained subdued and has now closed for 13 consecutive days below 11 thereby enabling the major indexes to continue hovering in nosebleed territory.
Interest rates rose a tad with the 20-year Treasury Bond ETF (TLT) losing -0.12%; the US dollar went the opposite way and added +0.12% to now remain firmly above its 200-day M/A after recently having dropped below it.
- ETFs in the Spotlight (updated for 2017)
In case you missed the announcement and description of this section, you can read it here again.
It features 10 broadly diversified and sector ETFs from my HighVolume list as posted every Saturday. Furthermore, they are screened for the lowest MaxDD% number meaning they have been showing better resistance to temporary sell offs than all others over the past year.
The below table simply demonstrates the magnitude with which some of the ETFs are fluctuating in regards to their positions above or below their respective individual trend lines (%M/A). A break below, represented by a negative number, shows weakness, while a break above, represented by a positive percentage, shows strength.
For hundreds of ETF choices, be sure to reference Thursday’s StatSheet.
Year to date, here’s how the 2017 candidates have fared so far:
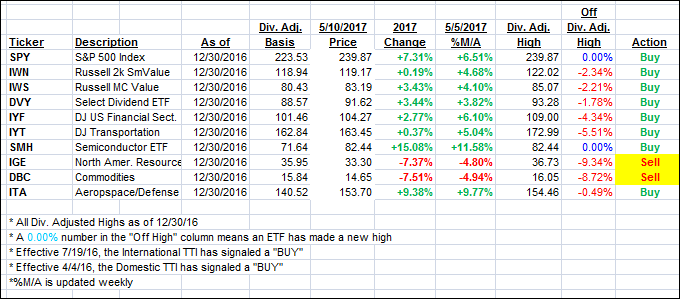
Again, the %M/A column above shows the position of the various ETFs in relation to their respective long term trend lines, while the trailing sell stops are being tracked in the “Off High” column. The “Action” column will signal a “Sell” once the -7.5% point has been taken out in the “Off High” column.
- Trend Tracking Indexes (TTIs)
Our Trend Tracking Indexes (TTIs) just about stood still as the major indexes continued to show no signs of volatility.
Here’s how we closed 5/10/2017:
Domestic TTI: +3.41% (last close +3.41%)—Buy signal effective 4/4/2016
International TTI: +8.16% (last close +8.07%)—Buy signal effective 7/19/2016
Disclosure: I am obliged to inform you that I, as well as my advisory clients, own some of the ETFs listed in the above table. Furthermore, they do not represent a specific investment recommendation for you, they merely show which ETFs from the universe I track are falling within the guidelines specified.
Contact Ulli