
- Moving the Markets
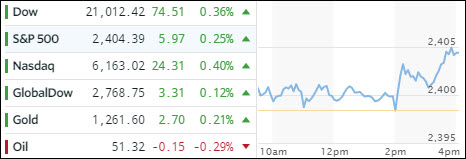
I’ve been mentioning the glass ceiling during recent posts, and today was the day when the S&P 500 managed to break out of a 4-day sideways pattern to close the session at a new record but only by a tiny margin while setting a 2017 volume low.
Most of the day was spent treading water as traders awaited the minutes from the last FOMC meeting, which indicated broad agreement on plans to begin shrinking the Fed’s balance sheet and also remain on target to ‘perhaps’ hike rates next month.
Things got really nutty in the markets, when the Fed said:
“Asset valuation pressures in some markets were notable…vulnerabilities appeared to have increased for asset valuation pressures…a sharp decline in such valuations could pose risks to financial stability.”
A very clear message, but the markets took it as a positive (huh?), and the S&P and Nasdaq went on set new record highs. Sometimes you just have to laugh…
The US dollar hit the skids again after yesterday’s rebound with UUP slipping -0.32%. Treasury yields fell with the 20-year bond TLT gaining +0.56% joined by gold and silver, which both closed in the green.
- ETFs in the Spotlight (updated for 2017)
In case you missed the announcement and description of this section, you can read it here again.
It features 10 broadly diversified and sector ETFs from my HighVolume list as posted every Saturday. Furthermore, they are screened for the lowest MaxDD% number meaning they have been showing better resistance to temporary sell offs than all others over the past year.
The below table simply demonstrates the magnitude with which some of the ETFs are fluctuating in regards to their positions above or below their respective individual trend lines (%M/A). A break below, represented by a negative number, shows weakness, while a break above, represented by a positive percentage, shows strength.
For hundreds of ETF choices, be sure to reference Thursday’s StatSheet.
Year to date, here’s how the 2017 candidates have fared so far:
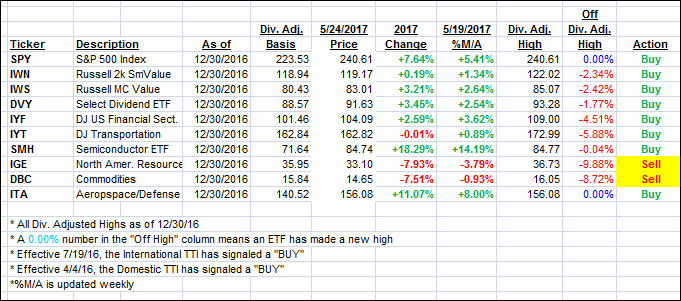
Again, the %M/A column above shows the position of the various ETFs in relation to their respective long term trend lines, while the trailing sell stops are being tracked in the “Off High” column. The “Action” column will signal a “Sell” once the -7.5% point has been taken out in the “Off High” column.
- Trend Tracking Indexes (TTIs)
Our Trend Tracking Indexes (TTIs) headed north and benefitted from the S&P and Nasdaq setting new all-time highs.
Here’s how we closed 5/24/2017:
Domestic TTI: +3.54% (last close +3.36%)—Buy signal effective 4/4/2016
International TTI: +8.62% (last close +8.28%)—Buy signal effective 7/19/2016
Disclosure: I am obliged to inform you that I, as well as my advisory clients, own some of the ETFs listed in the above table. Furthermore, they do not represent a specific investment recommendation for you, they merely show which ETFs from the universe I track are falling within the guidelines specified.
Contact Ulli