
- Moving the Markets
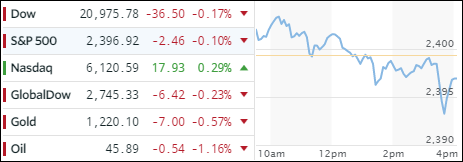
It was another non-eventful day in the markets with the Dow and S&P inching lower, however, the Nasdaq managed to eked out a new high. While earnings reports have been holding up, the spanking being dished out almost daily in the oil market along with opinions from the various Fed mouthpieces kept the markets in a tight trading range.
For sure, a new catalyst is needed to push markets higher, although these days just the absence of bad news could be enough to send the indexes nibbling at new all-time highs. However, given the almost daily load of deteriorating economic fundamentals, the odds are increasing that eventually gravity will take over and pull the indexes off their lofty levels down to a point that represents reality, which has been sorely lacking.
Has upside momentum started to slow down? It depends what indicators you look at. Our Trend Tracking Indexes (TTIs) represent the big long-term picture, and they are firmly entrenched on the bullish side of their respective trend lines. Of course, I am always looking for the canary in the coalmine that might give me some short-term indication of waning momentum.
One of those short-term indicators in regards to the S&P 500 is the change in the number of companies above their 50-day and 200-day moving averages. Take a look at this 6-month chart:
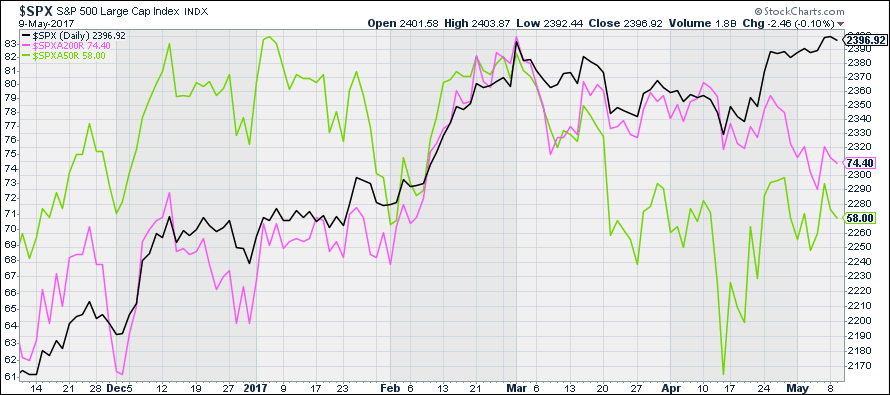
It shows the S&P 500 (black) and the number of stocks above their 50-day M/As (green) and their 200-day M/As (pink). While the stocks above their 50-day M/As are more volatile than the stocks above their 200-day M/As, the picture is clear. Both have disconnected from the index itself and are diverging from it.
What that means is that short-term momentum is weakening but more importantly the S&P index is being held up by only a handful of large companies such as Apple, Amazon, Microsoft and Google, to name a few of the heavy hitters. As time goes on, this is not sustainable and either the S&P will head south or the “other” stocks will have to rally to carry some of their weight to maintain current index levels.
- ETFs in the Spotlight (updated for 2017)
In case you missed the announcement and description of this section, you can read it here again.
It features 10 broadly diversified and sector ETFs from my HighVolume list as posted every Saturday. Furthermore, they are screened for the lowest MaxDD% number meaning they have been showing better resistance to temporary sell offs than all others over the past year.
The below table simply demonstrates the magnitude with which some of the ETFs are fluctuating in regards to their positions above or below their respective individual trend lines (%M/A). A break below, represented by a negative number, shows weakness, while a break above, represented by a positive percentage, shows strength.
For hundreds of ETF choices, be sure to reference Thursday’s StatSheet.
Year to date, here’s how the 2017 candidates have fared so far:
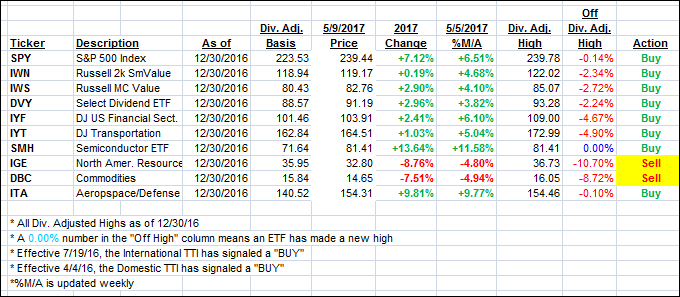
Again, the %M/A column above shows the position of the various ETFs in relation to their respective long term trend lines, while the trailing sell stops are being tracked in the “Off High” column. The “Action” column will signal a “Sell” once the -7.5% point has been taken out in the “Off High” column.
- Trend Tracking Indexes (TTIs)
Our Trend Tracking Indexes (TTIs) hardly moved as range bound trading continued.
Here’s how we closed 5/9/2017:
Domestic TTI: +3.41% (last close +3.41%)—Buy signal effective 4/4/2016
International TTI: +8.07% (last close +8.18%)—Buy signal effective 7/19/2016
Disclosure: I am obliged to inform you that I, as well as my advisory clients, own some of the ETFs listed in the above table. Furthermore, they do not represent a specific investment recommendation for you, they merely show which ETFs from the universe I track are falling within the guidelines specified.
Contact Ulli