
- Moving the Markets
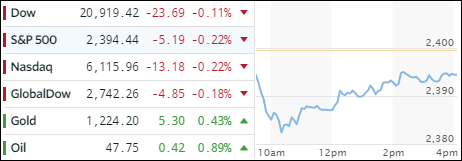
Right out of the gate, the major indexes skidded with the S&P 500 dropping -0.75% before the dip buying crowd (or was it the Fed?) stepped in to save the day. While we still closed below the unchanged line, the early losses were reduced. Nevertheless, after the almost comatose state of the markets of the past 2 weeks, the VIX finally showed some signs of life but was subdued by the end of the session.
Weaker than expected earnings and a slumping retail sector along with worries about possible delays in Trump’s pro-business agenda kept buying appetite in check. The retail bloodbath continued with Macy’s stock crashing after store sales tumbled worse than the already low consensus estimate.
US producer prices spiked the most in 5 years and have now, for third month in a row, risen faster than the Fed’s mandate. Interestingly, they are well above the highest analysts’ estimates despite dis-inflationary pressures from China being seen in industrial metals.
In regards to China, when looking at the global picture of YTD equity performance, one stands out, unfortunately as a bad example. Take a look at this revealing chart:
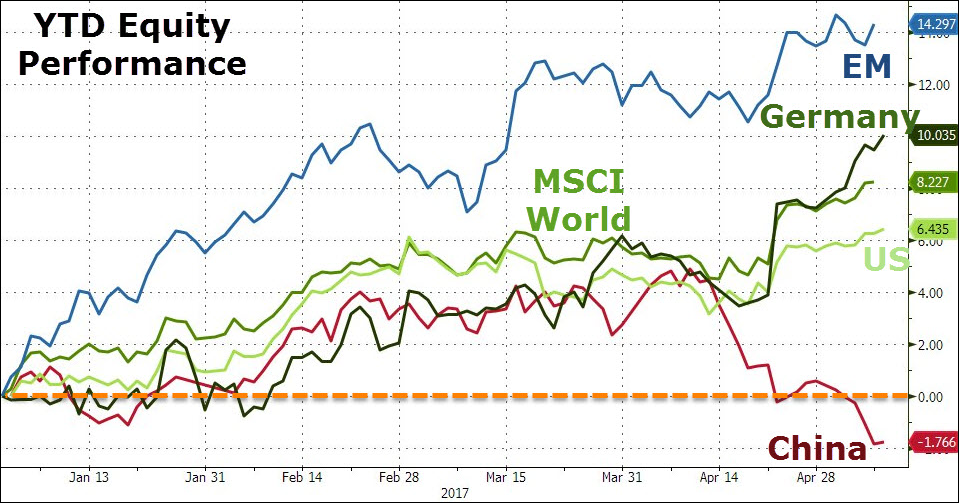
Source: ZH
As you can see, the emerging markets (EM) are still leading but China has now suddenly decoupled from the rest of the world as of late April. Will they be the proverbial canary in the coalmine and serve as a harbinger of things to come? We’ll have to wait to find out.
- ETFs in the Spotlight (updated for 2017)
In case you missed the announcement and description of this section, you can read it here again.
It features 10 broadly diversified and sector ETFs from my HighVolume list as posted every Saturday. Furthermore, they are screened for the lowest MaxDD% number meaning they have been showing better resistance to temporary sell offs than all others over the past year.
The below table simply demonstrates the magnitude with which some of the ETFs are fluctuating in regards to their positions above or below their respective individual trend lines (%M/A). A break below, represented by a negative number, shows weakness, while a break above, represented by a positive percentage, shows strength.
For hundreds of ETF choices, be sure to reference Thursday’s StatSheet.
Year to date, here’s how the 2017 candidates have fared so far:

Again, the %M/A column above shows the position of the various ETFs in relation to their respective long term trend lines, while the trailing sell stops are being tracked in the “Off High” column. The “Action” column will signal a “Sell” once the -7.5% point has been taken out in the “Off High” column.
- Trend Tracking Indexes (TTIs)
Our Trend Tracking Indexes (TTIs) finally showed some movement with both of them slipping but only by a small margin.
Here’s how we closed 5/11/2017:
Domestic TTI: +3.30% (last close +3.41%)—Buy signal effective 4/4/2016
International TTI: +7.95% (last close +8.16%)—Buy signal effective 7/19/2016
Disclosure: I am obliged to inform you that I, as well as my advisory clients, own some of the ETFs listed in the above table. Furthermore, they do not represent a specific investment recommendation for you, they merely show which ETFs from the universe I track are falling within the guidelines specified.
Contact Ulli