
- Moving the Markets
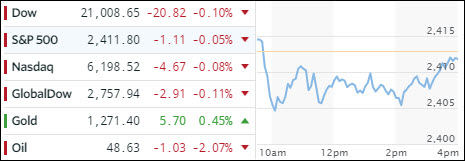
For the second day in a row, the major indexes limped slightly lower but ended up closing the out the month on the plus side. The Nasdaq took the lead with +2.5%, followed by the S&P 500 with +1.2%, while the Dow desperately hung on to the unchanged line but conquering it by a scant +0.3%.
The economic hits kept coming even though I don’t particularly look for them. Financials headed south, because two of the largest banks (JPM, BofA) signaling a trading slow down, warning that revenue will be down as much as 15%, pushing them into the red YTD. Macro data collapsed for the second month in a row, the biggest sequential drop in US economic conditions since May 2011, according to ZH.
Pending home sales in April hit the skids and tumbled 5.4% YoY, which is their biggest drop since the middle of 2014. Crude Oil tanked again and appears to be firmly stuck below the $50 level. Interest rates slipped with the 10-year T-Bond (TLT) gaining +0.25%. The US Dollar (UUP) headed lower losing -0.24% today but gave back -2.1% for May; it’s down YTD by -5.3%.
- ETFs in the Spotlight (updated for 2017)
In case you missed the announcement and description of this section, you can read it here again.
It features 10 broadly diversified and sector ETFs from my HighVolume list as posted every Saturday. Furthermore, they are screened for the lowest MaxDD% number meaning they have been showing better resistance to temporary sell offs than all others over the past year.
The below table simply demonstrates the magnitude with which some of the ETFs are fluctuating in regards to their positions above or below their respective individual trend lines (%M/A). A break below, represented by a negative number, shows weakness, while a break above, represented by a positive percentage, shows strength.
For hundreds of ETF choices, be sure to reference Thursday’s StatSheet.
Year to date, here’s how the 2017 candidates have fared so far:
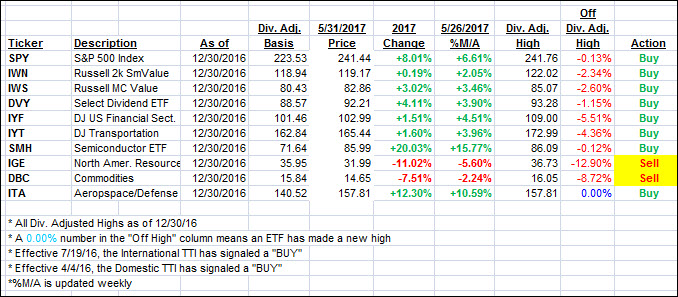
Again, the %M/A column above shows the position of the various ETFs in relation to their respective long term trend lines, while the trailing sell stops are being tracked in the “Off High” column. The “Action” column will signal a “Sell” once the -7.5% point has been taken out in the “Off High” column.
- Trend Tracking Indexes (TTIs)
Our Trend Tracking Indexes (TTIs) barely nudged as activity was muted on this last day of May.
Here’s how we closed 5/31/2017:
Domestic TTI: +3.68% (last close +3.66%)—Buy signal effective 4/4/2016
International TTI: +8.06% (last close +8.12%)—Buy signal effective 7/19/2016
Disclosure: I am obliged to inform you that I, as well as my advisory clients, own some of the ETFs listed in the above table. Furthermore, they do not represent a specific investment recommendation for you, they merely show which ETFs from the universe I track are falling within the guidelines specified.
Contact Ulli