
- Moving the Markets
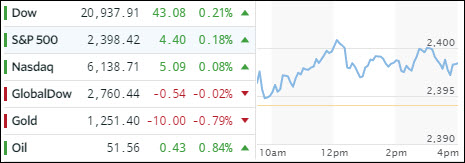
The major indexes managed to stay above the unchanged line throughout the session (on low volume) and kept bouncing against the invisible glass ceiling also known as new all-time highs. There was not enough momentum to break through, and it appears that we’ll be having a fairly quiet week as far as politics is concerned as Trump is still traveling outside the US.
Market levels remain totally disconnected from underlying economic realities with the US Macro data indicator dumping to its lowest point since February 2016 (see chart below) when the markets were about to crash but were saved thanks to Fed intervention.
Here are some of the more visible components:
- New home sales for April plunge 14.4% MoM
- Biggest drop occurred in the West, which saw a 26.3% collapse
- Manufacturing slumps to 8-month lows
Treasury yields spiked to their highest level in a week, which gave the US dollar an excuse to rally for a change (UUP +0.44%) but kept a lid on stock advances while also pushing gold lower and towards the 1,250 level.
At the end of the session, we closed in the green, but the Macro data chart below leaves me wondering ‘what’s next?’ if we had a true market that was left to its own devices:
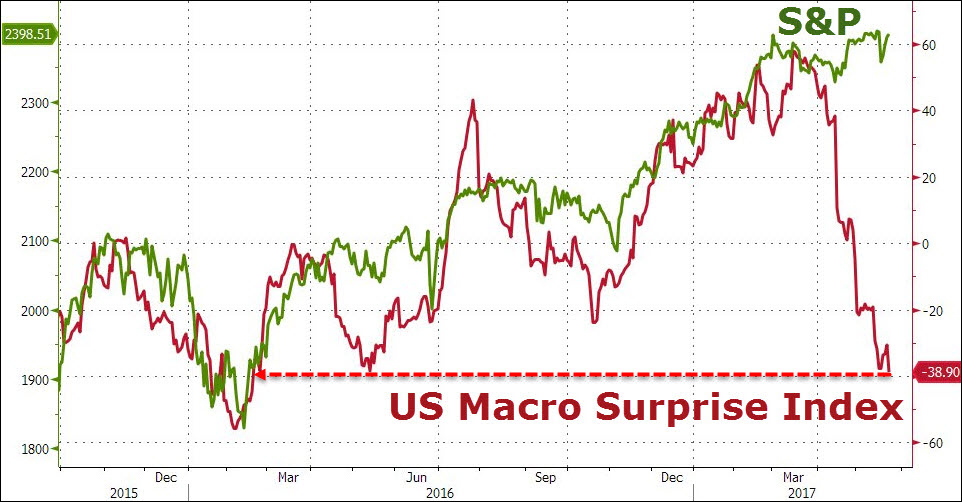
Source: ZeroHedge
- ETFs in the Spotlight (updated for 2017)
In case you missed the announcement and description of this section, you can read it here again.
It features 10 broadly diversified and sector ETFs from my HighVolume list as posted every Saturday. Furthermore, they are screened for the lowest MaxDD% number meaning they have been showing better resistance to temporary sell offs than all others over the past year.
The below table simply demonstrates the magnitude with which some of the ETFs are fluctuating in regards to their positions above or below their respective individual trend lines (%M/A). A break below, represented by a negative number, shows weakness, while a break above, represented by a positive percentage, shows strength.
For hundreds of ETF choices, be sure to reference Thursday’s StatSheet.
Year to date, here’s how the 2017 candidates have fared so far:
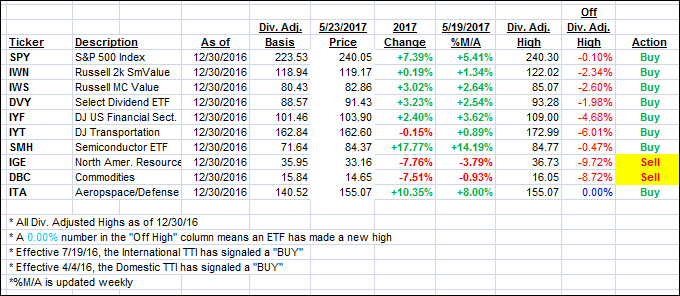
Again, the %M/A column above shows the position of the various ETFs in relation to their respective long term trend lines, while the trailing sell stops are being tracked in the “Off High” column. The “Action” column will signal a “Sell” once the -7.5% point has been taken out in the “Off High” column.
- Trend Tracking Indexes (TTIs)
Our Trend Tracking Indexes (TTIs) barely changed as markets gains presented a mixed picture.
Here’s how we closed 5/23/2017:
Domestic TTI: +3.36% (last close +3.36%)—Buy signal effective 4/4/2016
International TTI: +8.28% (last close +8.39%)—Buy signal effective 7/19/2016
Disclosure: I am obliged to inform you that I, as well as my advisory clients, own some of the ETFs listed in the above table. Furthermore, they do not represent a specific investment recommendation for you, they merely show which ETFs from the universe I track are falling within the guidelines specified.
Contact Ulli