
- Moving the Markets
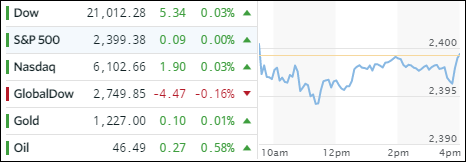
The major indexes spent today’s session in a tight range and clung to the unchanged line for most of the day. The outcome of the French elections sparked a “sell the news theme,” but US markets were stuck in a no volatility environment as the VIX was pushed down to its lowest close since December 1993, if you can believe that.
That is a condition that simply can’t last for very long but controlling the VIX is a great tool to manage any potential market sell-offs and keeping the bullish hope alive. In the absence of such control, we may see a repeat of what happened from January to March 1994 when the VIX jumped from 9.59 to over 28; by the way, the S&P 500 fell 10% during that period.
Apple was the big dog today with its stock rallying 3% likely in part based on news that Warren Buffett had sharply increased his stake in the company during the last quarter. Apple contributed to adding around 30 points to the Dow and broke the $800 billion market cap for the first time.
- ETFs in the Spotlight (updated for 2017)
In case you missed the announcement and description of this section, you can read it here again.
It features 10 broadly diversified and sector ETFs from my HighVolume list as posted every Saturday. Furthermore, they are screened for the lowest MaxDD% number meaning they have been showing better resistance to temporary sell offs than all others over the past year.
The below table simply demonstrates the magnitude with which some of the ETFs are fluctuating in regards to their positions above or below their respective individual trend lines (%M/A). A break below, represented by a negative number, shows weakness, while a break above, represented by a positive percentage, shows strength.
For hundreds of ETF choices, be sure to reference Thursday’s StatSheet.
Year to date, here’s how the 2017 candidates have fared so far:
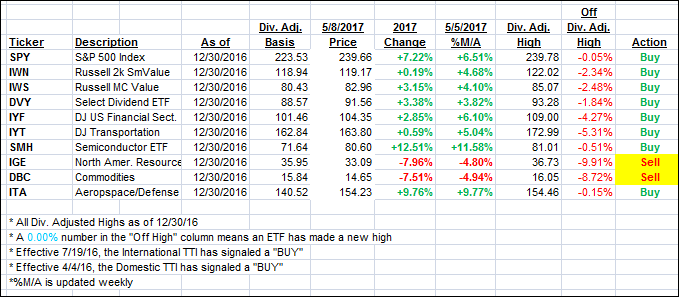
Again, the %M/A column above shows the position of the various ETFs in relation to their respective long term trend lines, while the trailing sell stops are being tracked in the “Off High” column. The “Action” column will signal a “Sell” once the -7.5% point has been taken out in the “Off High” column.
- Trend Tracking Indexes (TTIs)
Our Trend Tracking Indexes (TTIs) barely moved as a low volatility sideways market dominated the session.
Here’s how we closed 5/8/2017:
Domestic TTI: +3.41% (last close +3.46%)—Buy signal effective 4/4/2016
International TTI: +8.16% (last close +8.40%)—Buy signal effective 7/19/2016
Disclosure: I am obliged to inform you that I, as well as my advisory clients, own some of the ETFs listed in the above table. Furthermore, they do not represent a specific investment recommendation for you, they merely show which ETFs from the universe I track are falling within the guidelines specified.
Contact Ulli