
- Moving the Markets
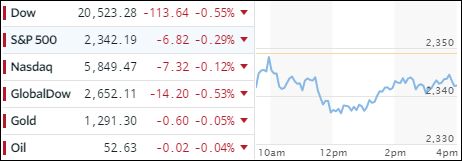
Just yesterday, I talked about how bond yields have been slipping and sliding despite the Fed’s efforts of hiking rates in December and March. The 10-year yield has dropped from 2.62% to 2.26% over the past 4 weeks. That trend accelerated today as that yield got slammed even more ending up at 2.18% for a loss of -3.54%.
Bond markets are usually ahead of stock markets in terms of anticipating future events, and what this move indicates is what I have been talking about for a long time, namely that the economy is heading south in a big way. This has been evident when looking at hard data, such as GDP forecast, EPS expectations, retail sales, subprime auto loans and commercial real estate just to name a few. The only questions remains: when will the equity market get the message?
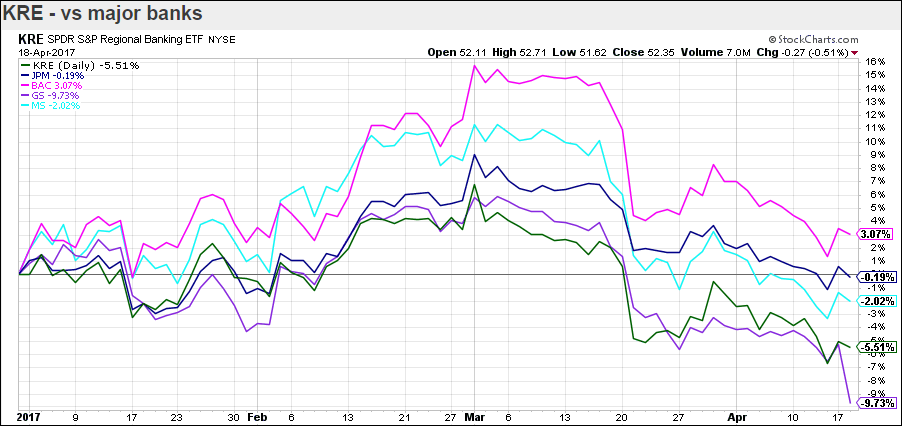
Not helping matters was a sharp tumble in the dollar (-0.79%) as the index broke below its psychologically important 100 level to close at 99.40. That is only a slip away from dropping below its 200-day M/A, which has functioned as a support level as recently as late March. Banks got hammered again with the loser of the year award going to Goldman Sachs which, as of March 1st had sported a YTD gain of almost 6% and has now slipped into negative territory showing a YTD performance of -9.73%.
In case you like to see the visual, here it is:
- ETFs in the Spotlight (updated for 2017)
In case you missed the announcement and description of this section, you can read it here again.
It features 10 broadly diversified and sector ETFs from my HighVolume list as posted every Saturday. Furthermore, they are screened for the lowest MaxDD% number meaning they have been showing better resistance to temporary sell offs than all others over the past year.
The below table simply demonstrates the magnitude with which some of the ETFs are fluctuating in regards to their positions above or below their respective individual trend lines (%M/A). A break below, represented by a negative number, shows weakness, while a break above, represented by a positive percentage, shows strength.
For hundreds of ETF choices, be sure to reference Thursday’s StatSheet.
Year to date, here’s how the 2017 candidates have fared so far:
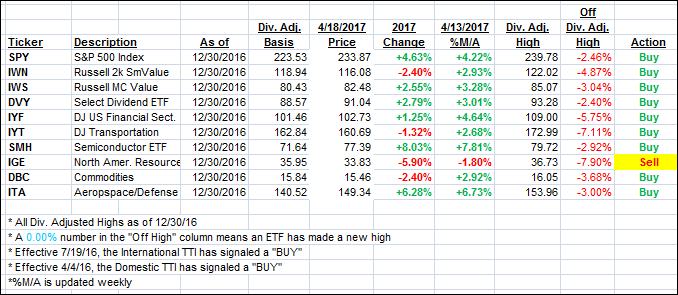
Again, the %M/A column above shows the position of the various ETFs in relation to their respective long term trend lines, while the trailing sell stops are being tracked in the “Off High” column. The “Action” column will signal a “Sell” once the -7.5% point has been taken out in the “Off High” column.
- Trend Tracking Indexes (TTIs)
Our Trend Tracking Indexes (TTIs) were mixed with the Domestic one gaining slightly, thanks to lower interest rates, while the International one slipped.
Here’s how we closed 4/18/2017:
Domestic TTI: +2.30% (last close +2.25%)—Buy signal effective 4/4/2016
International TTI: +4.44% (last close +4.66%)—Buy signal effective 7/19/2016
Disclosure: I am obliged to inform you that I, as well as my advisory clients, own some of the ETFs listed in the above table. Furthermore, they do not represent a specific investment recommendation for you, they merely show which ETFs from the universe I track are falling within the guidelines specified.
Contact Ulli