
- Moving the Markets
The 1st round of the French election results provided relief and hope that the current leading candidate of left wing persuasion (Emmanuel Macron) will be the one winning the final election in a couple of weeks by defeating the right-wing anti-euro and anti-establishment Marine Le Pen in a run-off.
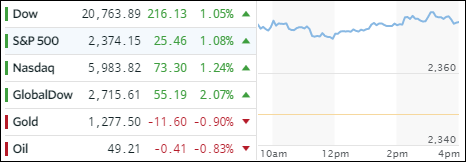
While Macron’s lead is fairly small, hope was high that the market favorite will become France’s next leader. Global equities shifted into rally mode with the French CAC 400 gaining +4.14%. All major indexes joined the fun, but the Nasdaq fell just short of conquering the 6,000 milestone marker.
Not to be outdone by international events, President Trump stepped up to the plate ahead of his anticipated tax announcement on Wednesday and “ordered” his aides to accelerate efforts to create a tax plan “slashing the corporate rate to 15% and prioritizing cuts in taxes over an attempt to not increase the deficit.” Let’s see how much opposition this idea will create and if it will be DOA.
Interest rates rose with the yield on the 10-year Treasury shooting up +1.79% to end at 2.28%, while the US dollar index gapped down to close at 98.97 and is in danger of breaking its 200-day M/A to the downside. That would be bearish as this support line has held since October 2016.
With the markets being caught up in euphoria, let me again be the voice of reason by pointing to the following two charts that require no comment or explanation:
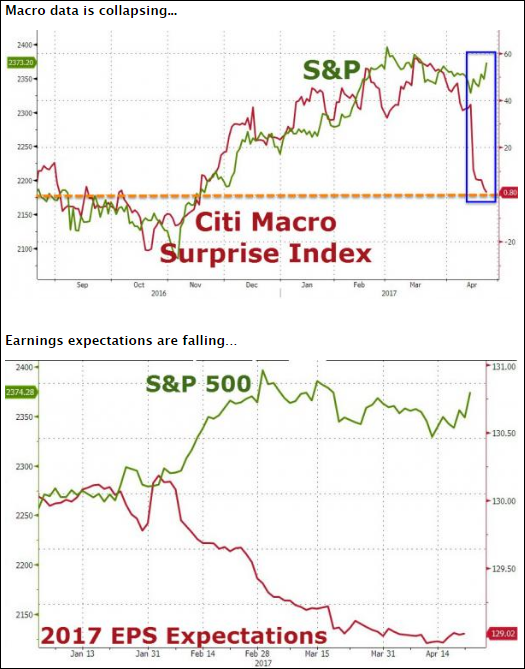
Charts courtesy of ZH
- ETFs in the Spotlight (updated for 2017)
In case you missed the announcement and description of this section, you can read it here again.
It features 10 broadly diversified and sector ETFs from my HighVolume list as posted every Saturday. Furthermore, they are screened for the lowest MaxDD% number meaning they have been showing better resistance to temporary sell offs than all others over the past year.
The below table simply demonstrates the magnitude with which some of the ETFs are fluctuating in regards to their positions above or below their respective individual trend lines (%M/A). A break below, represented by a negative number, shows weakness, while a break above, represented by a positive percentage, shows strength.
For hundreds of ETF choices, be sure to reference Thursday’s StatSheet.
Year to date, here’s how the 2017 candidates have fared so far:
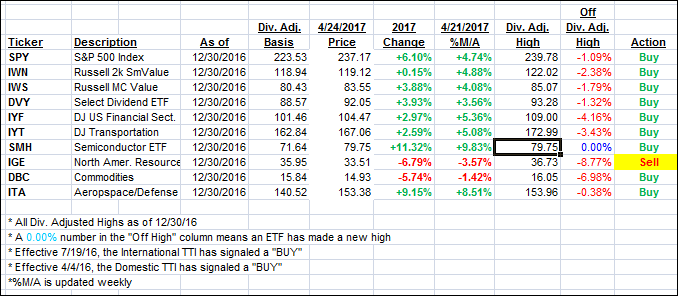
Again, the %M/A column above shows the position of the various ETFs in relation to their respective long term trend lines, while the trailing sell stops are being tracked in the “Off High” column. The “Action” column will signal a “Sell” once the -7.5% point has been taken out in the “Off High” column.
- Trend Tracking Indexes (TTIs)
Our Trend Tracking Indexes (TTIs) followed the positive market mood and jumped higher.
Here’s how we closed 4/24/2017:
Domestic TTI: +2.92% (last close +2.46%)—Buy signal effective 4/4/2016
International TTI: +6.55% (last close +4.68%)—Buy signal effective 7/19/2016
Disclosure: I am obliged to inform you that I, as well as my advisory clients, own some of the ETFs listed in the above table. Furthermore, they do not represent a specific investment recommendation for you, they merely show which ETFs from the universe I track are falling within the guidelines specified.
Contact Ulli