
- Moving the Markets
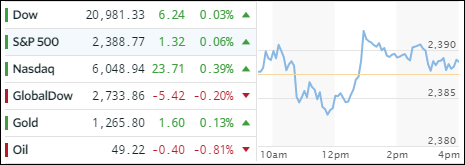
Earnings were in the spotlight and threw an assist to the Nasdaq pushing it into record territory, while the Dow and S&P 500 drifted and barely closed above the unchanged line. Despite the gains by companies like Comcast, PayPal and Intuit, the market had to deal with a menu of uncertainties (hat tip to ZH for this summary):
- Disappointing hard and soft data
- Growing government shutdown fears
- Collapsing GDP expectations
- Declining earnings expectations
- Plunging Crude Oil
- North Korea threats
The recent levitation of the Nasdaq helped SMH, a semi conductor ETF, which is part of our “10 ETFs in the Spotlight” (section 2 below), to continue its rally with a YTD gain of almost 13% and remaining the leader of the pack.
The US dollar went sideways but managed to close up +0.09%, gold gained a tad while the 20-year Treasury bond slipped a tiny -0.03% as interest rates closed higher. The major banks ended up lower ever since Trump announced his tax plan.
- ETFs in the Spotlight (updated for 2017)
In case you missed the announcement and description of this section, you can read it here again.
It features 10 broadly diversified and sector ETFs from my HighVolume list as posted every Saturday. Furthermore, they are screened for the lowest MaxDD% number meaning they have been showing better resistance to temporary sell offs than all others over the past year.
The below table simply demonstrates the magnitude with which some of the ETFs are fluctuating in regards to their positions above or below their respective individual trend lines (%M/A). A break below, represented by a negative number, shows weakness, while a break above, represented by a positive percentage, shows strength.
For hundreds of ETF choices, be sure to reference Thursday’s StatSheet.
Year to date, here’s how the 2017 candidates have fared so far:
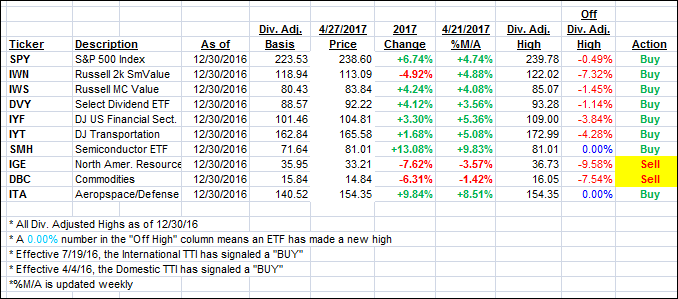
Again, the %M/A column above shows the position of the various ETFs in relation to their respective long term trend lines, while the trailing sell stops are being tracked in the “Off High” column. The “Action” column will signal a “Sell” once the -7.5% point has been taken out in the “Off High” column.
- Trend Tracking Indexes (TTIs)
Our Trend Tracking Indexes (TTIs) were mixed again with the domestic one gaining and the international one pulling back from its lofty level.
Here’s how we closed 4/27/2017:
Domestic TTI: +3.32% (last close +3.16%)—Buy signal effective 4/4/2016
International TTI: +7.36% (last close +7.44%)—Buy signal effective 7/19/2016
Disclosure: I am obliged to inform you that I, as well as my advisory clients, own some of the ETFs listed in the above table. Furthermore, they do not represent a specific investment recommendation for you, they merely show which ETFs from the universe I track are falling within the guidelines specified.
Contact Ulli