
- Moving the Markets
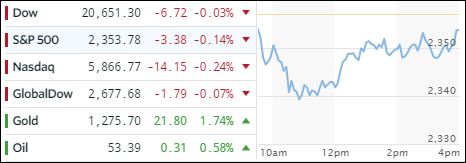
As saber rattling continues to be the topic du jour, it’s no surprise that gold has been the main beneficiary by not just being the leader YTD for 2017, but also finally conquering its 5-month glass ceiling, namely its 200-day M/A. We’ll have to wait and see if current momentum can propel gold across its 1,300 level after having hovered below it since Election Day.
In terms of current hot spots and war mongering, ZH summed it up nicely:
- US threatens North Korea
- Everyone on the same side of the boat (long stocks, short volatility, short bonds, short Eurodollars)
- US threatens Russia
- Fed intent on tightening no matter what
- China warns of red lines
- Russia calls ‘false flag’, builds alliance
- US threatens Syria
- Increased frequency of terror attacks in Europe
- Oh, and finally, Frexit looms as election in Europe are highly uncertain
Across asset classes, we saw the dollar weakening, oil rising, the 10-year Treasury yield slipping and equities desperately trying to get back to the unchanged line, which they almost managed to do after the early morning sell-off. The tech sector, however, continued to show weakness while bank stocks have given the words “one way street” (south) a new meaning since Trump’s speech to congress.
Things look a little wobbly right now and much focus is on the upcoming earnings season to see if new drivers can emerge to establish better upward momentum.
- ETFs in the Spotlight (updated for 2017)
In case you missed the announcement and description of this section, you can read it here again.
It features 10 broadly diversified and sector ETFs from my HighVolume list as posted every Saturday. Furthermore, they are screened for the lowest MaxDD% number meaning they have been showing better resistance to temporary sell offs than all others over the past year.
The below table simply demonstrates the magnitude with which some of the ETFs are fluctuating in regards to their positions above or below their respective individual trend lines (%M/A). A break below, represented by a negative number, shows weakness, while a break above, represented by a positive percentage, shows strength.
For hundreds of ETF choices, be sure to reference Thursday’s StatSheet.
Year to date, here’s how the 2017 candidates have fared so far:
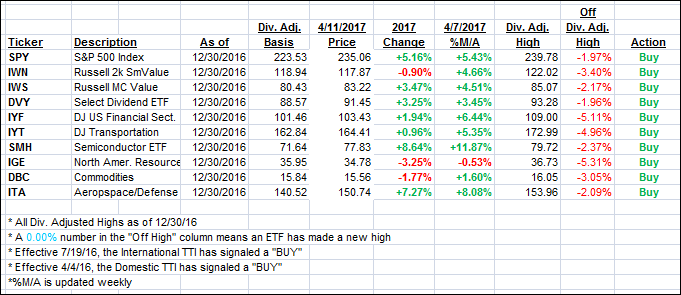
Again, the %M/A column above shows the position of the various ETFs in relation to their respective long term trend lines, while the trailing sell stops are being tracked in the “Off High” column. The “Action” column will signal a “Sell” once the -7.5% point has been taken out in the “Off High” column.
- Trend Tracking Indexes (TTIs)
Our Trend Tracking Indexes (TTIs) headed north despite the major indexes struggling to find a clear direction.
Here’s how we closed 4/11/2017:
Domestic TTI: +2.32% (last close +2.24%)—Buy signal effective 4/4/2016
International TTI: +4.93% (last close +4.86%)—Buy signal effective 7/19/2016
Disclosure: I am obliged to inform you that I, as well as my advisory clients, own some of the ETFs listed in the above table. Furthermore, they do not represent a specific investment recommendation for you, they merely show which ETFs from the universe I track are falling within the guidelines specified.
Contact Ulli