
- Moving the Markets
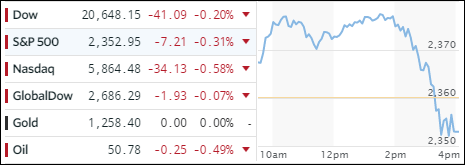
As the chart above shows, a morning rally got derailed in a hurry with the major indexes ending the session to the downside. A positive ADP report got things started in a northerly direction with the S&P 500 knocking on the 2,400 level. Data showed that 263,000 workers were added in March, which was higher than the expected number of 187,000 and also the largest addition since December 2014.
That was the green light for stocks to head higher, and the Dow jumped nearly 200 points. Suddenly, the Fed turned on the cold shower via its latest minutes delivering warning sound bites like you’d think you never hear from them explaining that “it was focusing not so much on inflation or employment, but was seeking to deflate what even “some members” of the FOMC agree is a stock bubble, warning that stock prices are “quite high”, and warning that its forecasts face “downside risks” if “financial markets were to experience a significant correction.”
Further adding:
“A few participants attributed the recent equity price appreciation to expectations for corporate tax cuts or to increased risk tolerance among investors rather than to expectations of stronger economic growth. Some participants viewed equity prices as quite high relative to standard valuation measures.”
And then this:
… a number of participants remarked that recent and prospective changes in financial conditions posed upside risks to their economic projections, to the extent that financial developments provided greater stimulus to spending than currently anticipated, as well as downside risks to their economic projections if, for example, financial markets were to experience a significant correction.
It took a while for traders and computer algos to digest these clearly defined warnings before things went south. The good thing was that the markets were “saved” by the closing bell. It is not often that we see Fed speak of such clarity, and we’ll have to wait and see if there is more fallout to come or if this initial reaction was an outlier.
- ETFs in the Spotlight (updated for 2017)
In case you missed the announcement and description of this section, you can read it here again.
It features 10 broadly diversified and sector ETFs from my HighVolume list as posted every Saturday. Furthermore, they are screened for the lowest MaxDD% number meaning they have been showing better resistance to temporary sell offs than all others over the past year.
The below table simply demonstrates the magnitude with which some of the ETFs are fluctuating in regards to their positions above or below their respective individual trend lines (%M/A). A break below, represented by a negative number, shows weakness, while a break above, represented by a positive percentage, shows strength.
For hundreds of ETF choices, be sure to reference Thursday’s StatSheet.
Year to date, here’s how the 2017 candidates have fared so far:
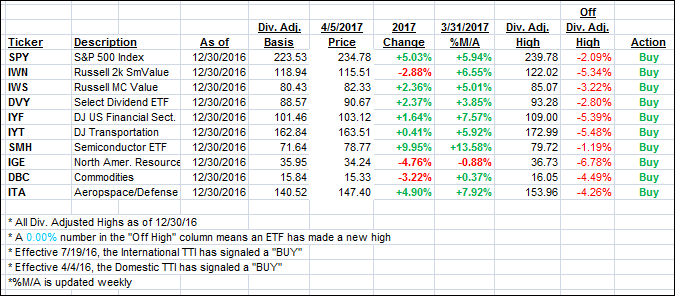
Again, the %M/A column above shows the position of the various ETFs in relation to their respective long term trend lines, while the trailing sell stops are being tracked in the “Off High” column. The “Action” column will signal a “Sell” once the -7.5% point has been taken out in the “Off High” column.
- Trend Tracking Indexes (TTIs)
Our Trend Tracking Indexes (TTIs) slipped a tad as morning rally faded.
Here’s how we closed 4/5/2017:
Domestic TTI: +2.27% (last close +2.42%)—Buy signal effective 4/4/2016
International TTI: +5.09% (last close +5.16%)—Buy signal effective 7/19/2016
Disclosure: I am obliged to inform you that I, as well as my advisory clients, own some of the ETFs listed in the above table. Furthermore, they do not represent a specific investment recommendation for you, they merely show which ETFs from the universe I track are falling within the guidelines specified.
Contact Ulli