
- Moving the Markets
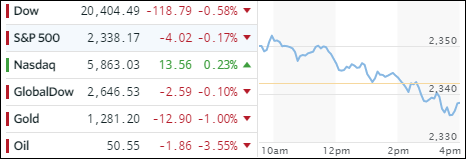
An encouraging morning rally ran out of steam mid-day with the major indexes heading south and closing below their unchanged lines. The exception was the Nasdaq, which managed to cling to a gain of +0.23%.
No macro data points were released today, but the weakness in the banking sector, which I addressed yesterday, continued with Goldman Sachs slipping further. IBM’s weak quarterly numbers were the other culprit; those two heavyweights contributed to about 50% of the Dow’s loss.
Treasury yields bounced a little with the 10-year recouping 3 points or +1.38% after yesterday’s loss of -3.54%. The US dollar followed suit and climbed +0.24%, but still remains below its 100 level.
The financial ETF XLF has been on a slide ever since hitting this year’s top around March 1st. Why is this important? The Trump rally, which started on November 7, was led by the financials with the S&P 500 following suit. This trend appears to have come to an end and has reversed as the following chart shows:
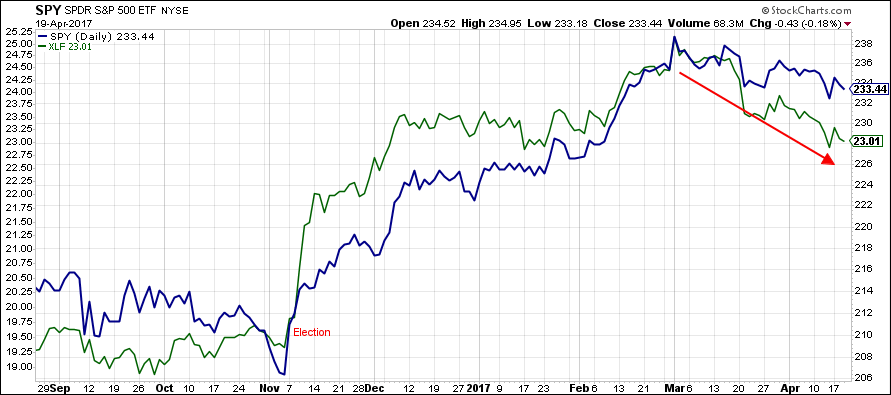
As you can see, shortly after the financials (green) headed south, the S&P (blue) followed suit but to a lesser degree. I look at this as being a potential canary in the coalmine to give me an advance warning as to what the near-term future might look like.
This is not a timing indicator but merely a sign of a weakening stock market, and it remains to be seen if this drop is simply a short-term aberration or a harbinger of things to come. The resumption of the bullish theme to new highs will not happen without the participation of the financial sector.
- ETFs in the Spotlight (updated for 2017)
In case you missed the announcement and description of this section, you can read it here again.
It features 10 broadly diversified and sector ETFs from my HighVolume list as posted every Saturday. Furthermore, they are screened for the lowest MaxDD% number meaning they have been showing better resistance to temporary sell offs than all others over the past year.
The below table simply demonstrates the magnitude with which some of the ETFs are fluctuating in regards to their positions above or below their respective individual trend lines (%M/A). A break below, represented by a negative number, shows weakness, while a break above, represented by a positive percentage, shows strength.
For hundreds of ETF choices, be sure to reference Thursday’s StatSheet.
Year to date, here’s how the 2017 candidates have fared so far:
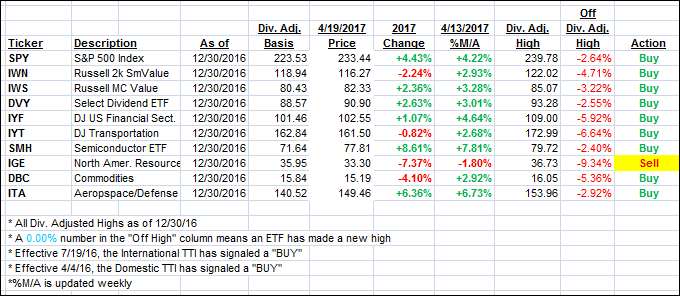
Again, the %M/A column above shows the position of the various ETFs in relation to their respective long term trend lines, while the trailing sell stops are being tracked in the “Off High” column. The “Action” column will signal a “Sell” once the -7.5% point has been taken out in the “Off High” column.
- Trend Tracking Indexes (TTIs)
Our Trend Tracking Indexes (TTIs) closed mixed as the major indexes gave back their early gains.
Here’s how we closed 4/19/2017:
Domestic TTI: +2.32% (last close +2.30%)—Buy signal effective 4/4/2016
International TTI: +4.33% (last close +4.44%)—Buy signal effective 7/19/2016
Disclosure: I am obliged to inform you that I, as well as my advisory clients, own some of the ETFs listed in the above table. Furthermore, they do not represent a specific investment recommendation for you, they merely show which ETFs from the universe I track are falling within the guidelines specified.
Contact Ulli