
- Moving the Markets
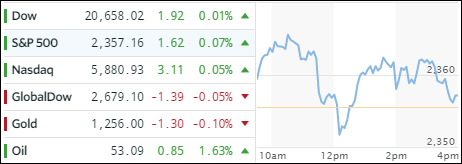
We started the week on a positive note when suddenly the markets took a dive below the unchanged line, crawled back above it and then closed with a tiny gain. Stocks were spooked on news reports that China had amassed some 150,000 troops along the North Korean border, which was enough to take the starch out of this rally.
Not helping matters were Secretary of State Tillerson’s remarks that the military strikes against Syria regarding its alleged use of chemical weapons were a warning signal to other nations, like N. Korea, as saber rattling was elevated to the next level.
Energy shares managed to gain with oil adding +1.63% offsetting some of the losses in the financial sector, as we are waiting for the earnings season to start this week. The 10-year Treasury yield went nowhere and slipped 1 point while the 30-year lost its 3% milestone and closed at 2.99%. The US dollar bobbed and weaved within a tight range and ended up surrendering -0.16%.
- ETFs in the Spotlight (updated for 2017)
In case you missed the announcement and description of this section, you can read it here again.
It features 10 broadly diversified and sector ETFs from my HighVolume list as posted every Saturday. Furthermore, they are screened for the lowest MaxDD% number meaning they have been showing better resistance to temporary sell offs than all others over the past year.
The below table simply demonstrates the magnitude with which some of the ETFs are fluctuating in regards to their positions above or below their respective individual trend lines (%M/A). A break below, represented by a negative number, shows weakness, while a break above, represented by a positive percentage, shows strength.
For hundreds of ETF choices, be sure to reference Thursday’s StatSheet.
Year to date, here’s how the 2017 candidates have fared so far:
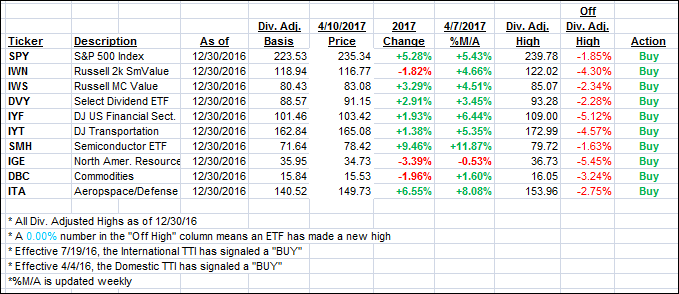
Again, the %M/A column above shows the position of the various ETFs in relation to their respective long term trend lines, while the trailing sell stops are being tracked in the “Off High” column. The “Action” column will signal a “Sell” once the -7.5% point has been taken out in the “Off High” column.
- Trend Tracking Indexes (TTIs)
Our Trend Tracking Indexes (TTIs) edged up as the major indexes went through a choppy session.
Here’s how we closed 4/10/2017:
Domestic TTI: +2.24% (last close +2.20%)—Buy signal effective 4/4/2016
International TTI: +4.86% (last close +4.76%)—Buy signal effective 7/19/2016
Disclosure: I am obliged to inform you that I, as well as my advisory clients, own some of the ETFs listed in the above table. Furthermore, they do not represent a specific investment recommendation for you, they merely show which ETFs from the universe I track are falling within the guidelines specified.
Contact Ulli