
- Moving the Markets
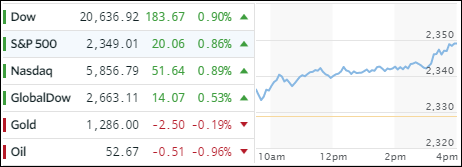
To me, today’s trading session had the look of a relief rally after last week’s sell-off, and the fact that the war mongering with N. Korea did not turn into anything more but jawboning over the Holiday weekend.
The major indexes gained solidly with the S&P 500 trying to make up the losses of the last 5 trading sessions but fell short by a few points. Oddly enough, interest rates have been slipping and sliding since early March when the 10-year T-bond peaked at a yield of 2.62% compared to today’s close of 2.26%. What’s going on here? The Fed has raised rates twice, namely in December and March and threatened at least 2 more hikes in 2017, yet rates are declining.
The answer is simple in that the bond market has not priced in any more hikes due to the fact that economic data points are weakening by the day with thousands of retail stores closing accompanied by 10’s of thousands of job losses while GDP is quickly stumbling towards zero. So, the Fed’s hike appears to be more a measure of caution so that they have some ammo to lower rates again once the long overdue recession is finally recognized.
The following chart makes this abundantly clear:
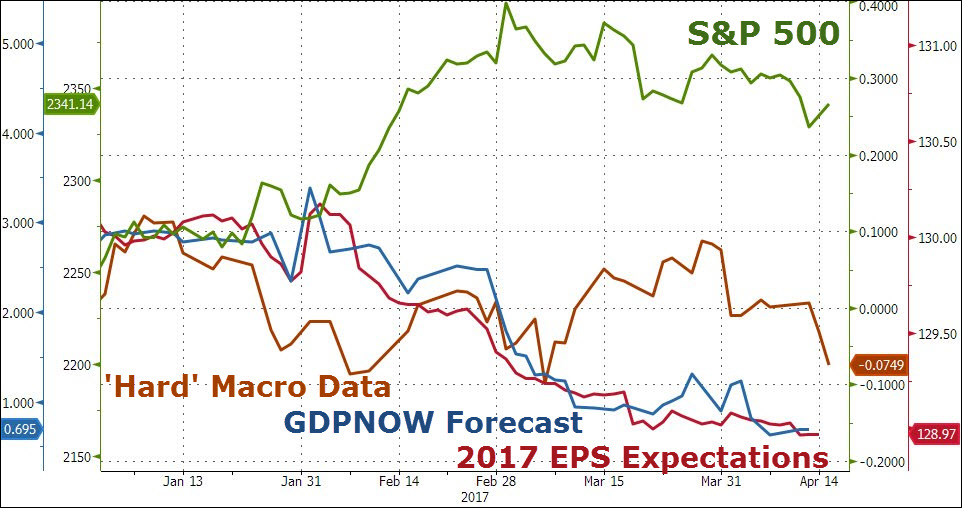
Chart courtesy of ZH
- ETFs in the Spotlight (updated for 2017)
In case you missed the announcement and description of this section, you can read it here again.
It features 10 broadly diversified and sector ETFs from my HighVolume list as posted every Saturday. Furthermore, they are screened for the lowest MaxDD% number meaning they have been showing better resistance to temporary sell offs than all others over the past year.
The below table simply demonstrates the magnitude with which some of the ETFs are fluctuating in regards to their positions above or below their respective individual trend lines (%M/A). A break below, represented by a negative number, shows weakness, while a break above, represented by a positive percentage, shows strength.
For hundreds of ETF choices, be sure to reference Thursday’s StatSheet.
Year to date, here’s how the 2017 candidates have fared so far:
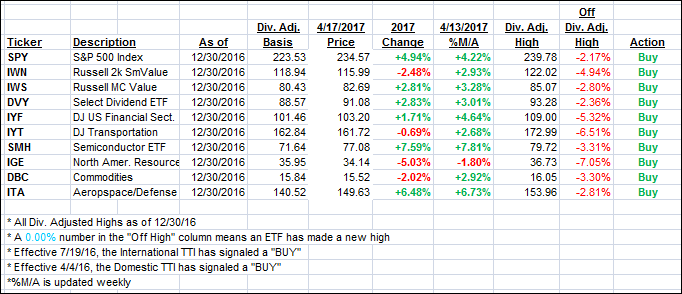
Again, the %M/A column above shows the position of the various ETFs in relation to their respective long term trend lines, while the trailing sell stops are being tracked in the “Off High” column. The “Action” column will signal a “Sell” once the -7.5% point has been taken out in the “Off High” column.
- Trend Tracking Indexes (TTIs)
Our Trend Tracking Indexes (TTIs) recovered from last week’s sell-off as the major indexes closed solidly in the green.
Here’s how we closed 4/17/2017:
Domestic TTI: +2.25% (last close +1.87%)—Buy signal effective 4/4/2016
International TTI: +4.66% (last close +4.13%)—Buy signal effective 7/19/2016
Disclosure: I am obliged to inform you that I, as well as my advisory clients, own some of the ETFs listed in the above table. Furthermore, they do not represent a specific investment recommendation for you, they merely show which ETFs from the universe I track are falling within the guidelines specified.
Contact Ulli